
Directional Derivative 002: Dynamic Visualization Along Rays and Curves
Loading the math board and drawing, please wait…
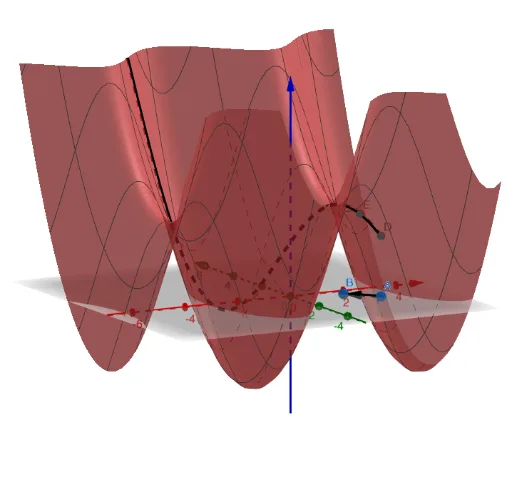
① This GeoGebra example dynamically demonstrates the directional derivative of a two-variable function at a point along a specified direction, visually showing the relationship between the tangent plane and the slope in that direction. ② The core mathematical concept is the directional derivative, i.e., the rate of change of the function along a unit vector, involving gradients, partial derivatives, tangent planes, and vector decomposition. ③ Construction highlights: uses Ray to define the direction, CurveCartesian to draw the path on the function surface, and Vector to represent the direction vector and gradient; objects include function f, points A, B, g, C, D, parameters a, t, point E, and vector u, with a slider controlling the direction angle and updating values in real time. ④ Suitable for university calculus or multivariable function courses, also useful for AP Calculus BC or engineering mathematics, helping students grasp the geometric meaning of directional derivatives and gradients, and how changing direction affects the slope.
GeoGebra Commands & Parameters
Ray(A, B) → gCurveCartesian((x(A) + (s * x(C)), y(A) + (s * y(C)), f(x(A) + (s * x(C)), y(A) + (s * y(C)))), s, 0, 10) → aVector(A, B) → u