
Dilation Scale Factor and Center Interactive Demo
Loading the math board and drawing, please wait…
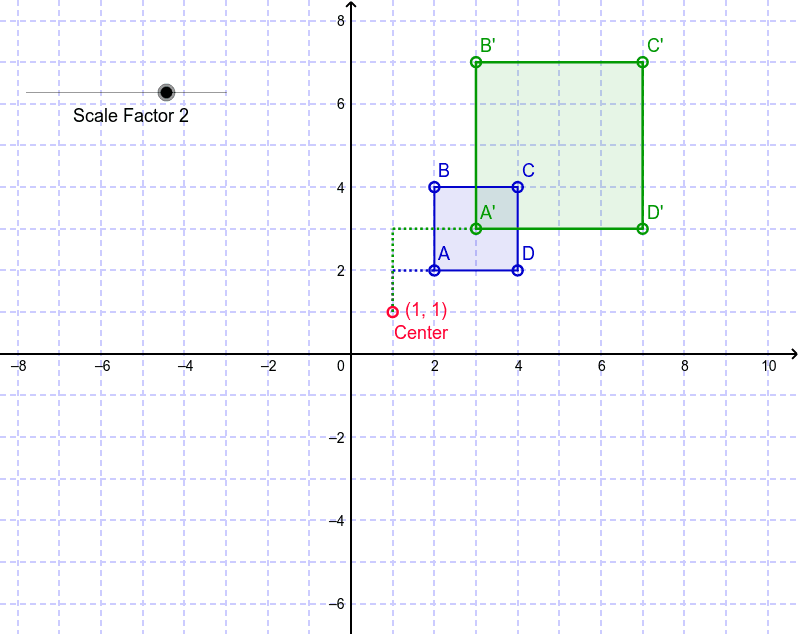
This GeoGebra example provides an interactive demonstration of dilation (homothety) of plane figures, clearly showing how the scale factor and the center of dilation affect the size and position of the transformed shape. The core mathematical concept is dilation transformation, including the role of positive/negative scale factors (enlargement, reduction, and reflection through the center) and the center as a fixed point. Construction details: a polygon is created using the Polygon command, then the Dilate command generates the dilated polygon with a specified center and scale factor; Segment and Rotate commands are used to draw connecting lines and angles between corresponding points. The object list includes original vertices A, B, C, D, dilated vertices A', B', C', D', and text objects text1 and text2 that dynamically display the scale factor value. This resource is suitable for middle school or high school students learning geometric transformations, and for teachers to demonstrate visually how changing the scale factor alters the image and how the center controls the transformation.
GeoGebra Commands & Parameters
Polygon(A, B, C, D) → poly1, a_1, b_1, c, dDilate(B, Angle, E) → B'Dilate(C, Angle, E) → C'Dilate(D, Angle, E) → D'Segment(E, A_p) → aSegment(A_p, A) → gDilate(A_p, Angle, E) → GDilate(A, Angle, E) → A'Segment(G, A') → g'Polygon(A', B', C', D') → poly2, a'_1, b', c', d'Rotate(E, -(Angle) * 3.141592653589793 / 180.0, E) → E'Dilate(A_p, Angle, E) → HSegment(E', H) → a'Dilate(A_p, Angle, E) → F