
Dilation of Sine and Cosine Curves
Loading the math board and drawing, please wait…
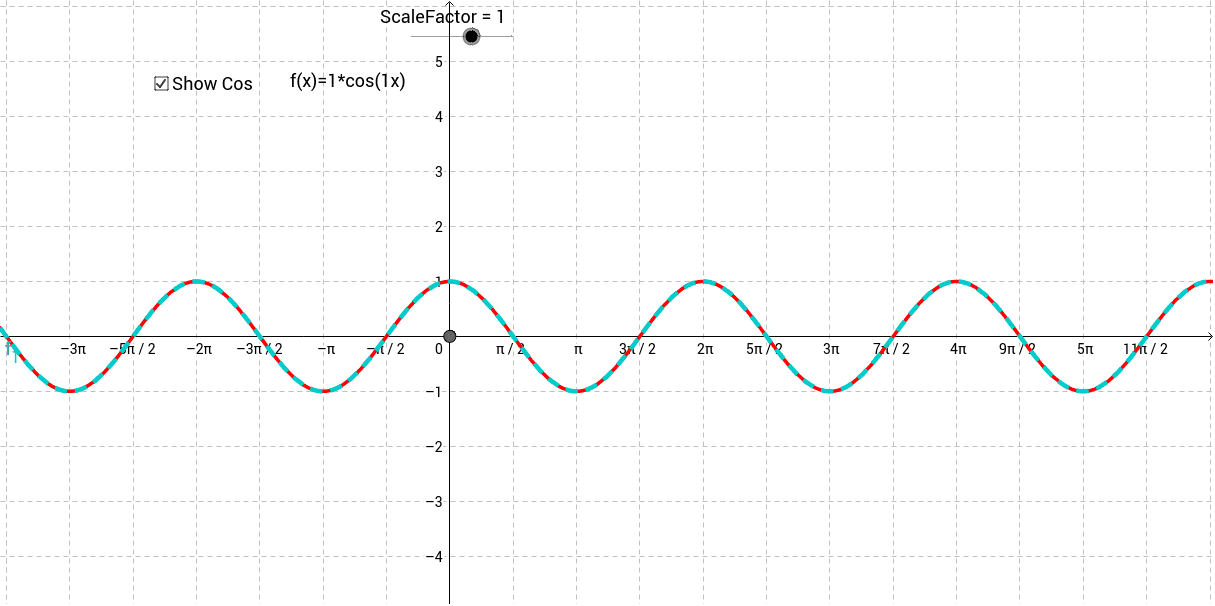
This example demonstrates how horizontal and vertical dilation transforms the graphs of sine and cosine functions, showing the relationship between scale factors, function equations, and curve shapes. Core concepts include trigonometric functions, geometric transformations, function graphing, amplitude, period, and vertical/horizontal stretching. Construction uses the GeoGebra Dilate command with objects such as ScaleFactor, ScaleHalf, Stretch_H, Stretch_V, and slider parameters a, v, h to manipulate base function f and its transformed images g and f_1, with text1 for annotations. Suitable for high school mathematics, trigonometry units, and classroom instruction or independent exploration of function transformations.
GeoGebra Commands & Parameters
Dilate(f, ScaleFactor, A) → f_1
AI Drawing Prompt Reference
Draw the basic sine and cosine curves, then add horizontal and vertical stretch sliders that control the period and amplitude scaling factors; apply a dilation centered at the origin to produce two transformed curves representing horizontal stretch, vertical stretch, and combined scaling, and annotate each curve with the current scale‑factor values to illustrate how the factors relate to the function equations and wave shapes.
The prompt above was compiled from the original drawing commands and is for reference only.