
Dice Roll Simulation by Martin Laroche
Loading the math board and drawing, please wait…
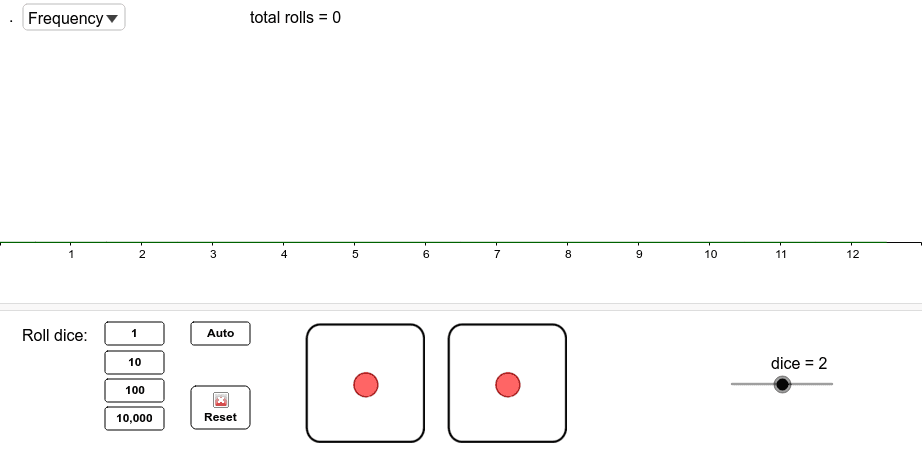
This example simulates rolling one, two, or three standard dice and explores the distribution of dice sums. It involves core concepts of probability and statistics, constructed using GeoGebra commands such as Sequence and BarChart, suitable for middle school and above students.
GeoGebra Commands & Parameters
Sequence(Element[freq, k], k, 1, (6 * dice) + 1) → freq2Sequence(Element[freq2, k] / n, k, 1, Length[freq2]) → relFreqSelectedIndex(graphMenu) → graphTypeIf(n ≟ 0, 0, Max[freq]) → fMaxSequence(k - 1, k, 1, (6 * dice) + 1) → diceSumBarChart(diceSum, relFreq) → relFreqChartIf(n ≟ 0, 0, Max[relFreq]) → relMaxBarChart(diceSum, freq2) → freqChartSequence(Text["" + (Element[relFreq, k]), (k - 1.3, Element[relFreq, k] + step)], k, 1, Length[relFreq]) → lbl2Sequence(If[Element[freq2, k] > 0, Text["" + (Element[freq2, k]), (k - 1.2, Element[freq2, k] + step)]], k, 1, Length[freq2]) → lbl
AI Drawing Prompt Reference
Simulate rolling one, two, or three standard dice to show the distribution of results, using bar charts to represent frequency and relative frequency, controlled by a slider for the number of dice, with key values labeled, starting with basic bar charts, then adding relative frequency bar charts and labels.
The prompt above was compiled from the original drawing commands and is for reference only.