
Dice Roll Distribution
Loading the math board and drawing, please wait…
In collections
Probability & Intro. to Stat.
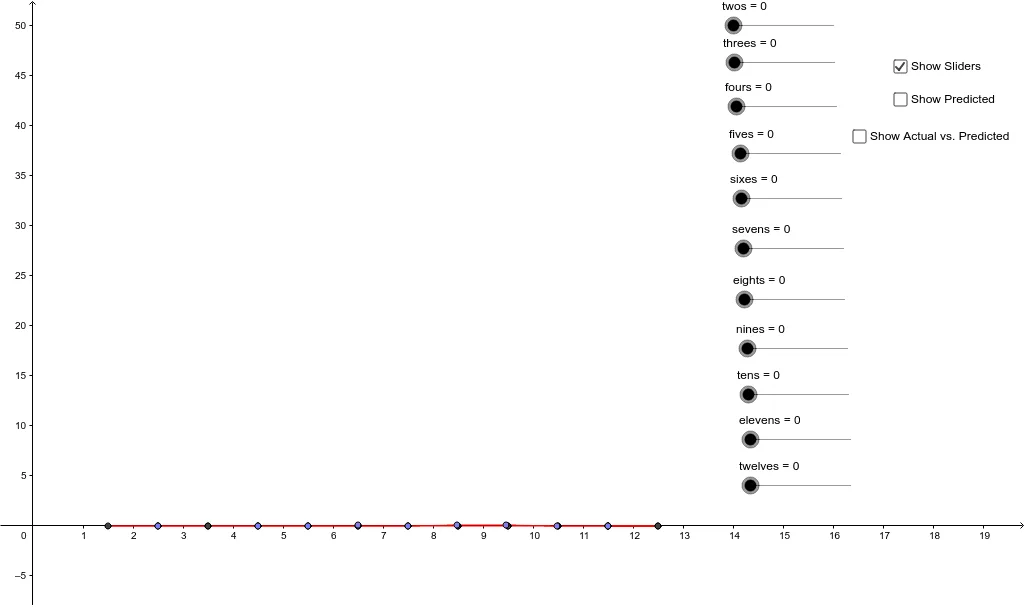
This example demonstrates the distribution of sums when rolling two dice multiple times. Key mathematical concepts include probability and frequency analysis. Construction involves GeoGebra commands like Polygon, Point, and Polyline to create the distribution chart. Suitable for middle school students learning probability and data visualization.
GeoGebra Commands & Parameters
Polygon(A, M, N, B) → poly1, a, m, n, bPolygon(O, P, C, B) → poly2, o, p, c_1, b_1Polygon(Q, R, D, C) → poly3, q, r, d, c_2Polygon(S, T, E, D) → poly4, s, t, e, d_1Polygon(U, V, F, E) → poly5, u, v, f, e_1Polygon(W, X, G, F) → poly6, w, A_1, g, f_1Polygon(Y, Z, H, G) → poly7, B_1, z, h, g_1Polygon(A1, B1, I, H) → poly8, a1, b1, i, h_1Polygon(C1, D1, J, I) → poly9, c1, d1, j, i_1Polygon(E1, J, K, F1) → poly10, e1, j_1, k, f1Polygon(K, G1, H1, L) → poly11, k_1, g1, h1, lPolygon(K_1, G1_1, H1_1, L_1) → poly11_1, k_2, g1_1, h1_1, l_1Polygon(I1, J1, B, A) → poly12, i1, j1, b_2, a_1Point(b_2) → C_1Polygon(K1, L1, C, C_1) → poly13, k1, l1, c_3, c_4Polygon(M1, N1, D, C) → poly14, m1, n1, d_2, c_5Point(d_2) → D_1Polygon(O1, P1, E, D_1) → poly15, o1, p1, e_2, d_3Point(e_2) → E_1Polygon(Q1, E_1, F, R1) → poly16, q1, e_3, f_2, r1Point(f_2) → F_1Polygon(S1, F_1, G, T1) → poly17, s1, f_3, g_2, t1Point(g_2) → G_1Polygon(U1, V1, H, G_1) → poly18, u1, v1, h_{10}, g_3Point(h_{10}) → H_1Polygon(H_1, I, X1, W1) → poly19, h_{11}, i_2, x1, w1Point(i_2) → I_1Polygon(Y1, Z1, J, I_1) → poly20, y1, z1, j_2, i_3Point(j_2) → J_1Polygon(A2, B2, K, J_1) → poly21, a2, b2, k_3, j_3Point(k_3) → M_1Polygon(C2, D2, L, M_1) → poly22, c2, d2, l_2, m_1
AI Drawing Prompt Reference
Create a graph showing the distribution of sums when rolling two dice multiple times, using polygons and polylines to represent frequency. Start with the possible sums from rolling two dice (2 to 12), each sum represented by different shapes with sizes indicating frequency, connected by lines to form a distribution chart, suitable for demonstrating probability and data analysis concepts.
The prompt above was compiled from the original drawing commands and is for reference only.