
Developing Basic Trig Function Graphs from a Circle
Loading the math board and drawing, please wait…
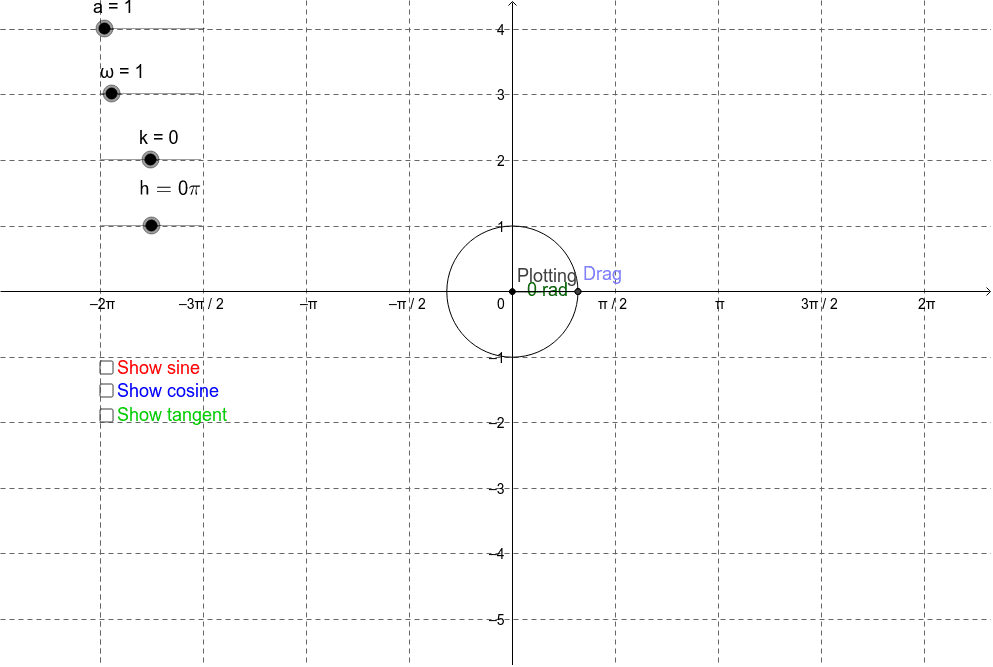
This example demonstrates how to develop the basic graphs of trigonometric functions from a circle. Key mathematical concepts include trigonometric functions, the unit circle, and geometric transformations. Using GeoGebra commands such as Circle, Point, Angle, Rotate, Segment, etc., the dynamic display of sine and cosine function graphs is shown. Suitable for high school mathematics education and learning.
GeoGebra Commands & Parameters
Circle(B, a) → cPoint(c) → CPoint(c) → DragAngle(C, B, Drag) → βRotate(C, (β * ω) - (h * 3.141592653589793), B) → PlottingAngle(C, B, Drag) → αSegment(D, E) → a_1Segment(B, Drag) → gSegment((x(Plotting), k), Plotting) → bSegment((α, k), F) → eSlope(Line[B, Plotting]) → mLine(B, Plotting) → nSegment((α, k), (α, m + k)) → fSegment(B, A) → d
AI Drawing Prompt Reference
Draw a unit circle with a center and a point on the circumference. Show the angle from the center to the point, rotate the point around the center by a certain angle, and connect the center to the rotated point. Draw a perpendicular line from the rotated point to the x-axis to form the sine and cosine function graphs, while displaying the relationship between the angle and the slope.
The prompt above was compiled from the original drawing commands and is for reference only.