
Describing Trends in Scatter Plots: IM 8.6.5 Lesson
Loading the math board and drawing, please wait…
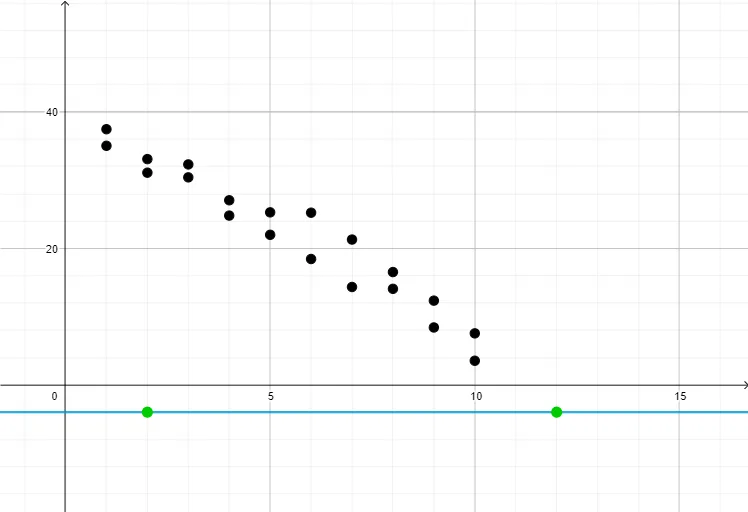
This GeoGebra example is a teaching demonstration for middle school mathematics, illustrating how to describe trends in scatter plots by fitting a line to data points. The core mathematical concepts include scatter plots, linear trends, line fitting, and data visualization. The construction uses 20 data points (pt1 to pt20) and corresponding visibility controls (show1 to show20), with the Line command to draw a trend line. By toggling the visibility of points, students can explore how the line summarizes the overall pattern. This resource is suitable for upper middle school or high school students learning statistics and data analysis, and can be used by teachers for classroom demonstrations to help students identify positive, negative, or no correlation in scatter plots.
GeoGebra Commands & Parameters
Line(A, B) → f
AI Drawing Prompt Reference
Create a scatter plot with 20 data points, each having a corresponding visibility control, and fit a line to these points to show a linear trend, allowing the visibility of points to be toggled to explore the overall pattern.
The prompt above was compiled from the original drawing commands and is for reference only.