
Derivatives and Histograms: Tangent Slope and Expected Value Dynamic Demo
Loading the math board and drawing, please wait…
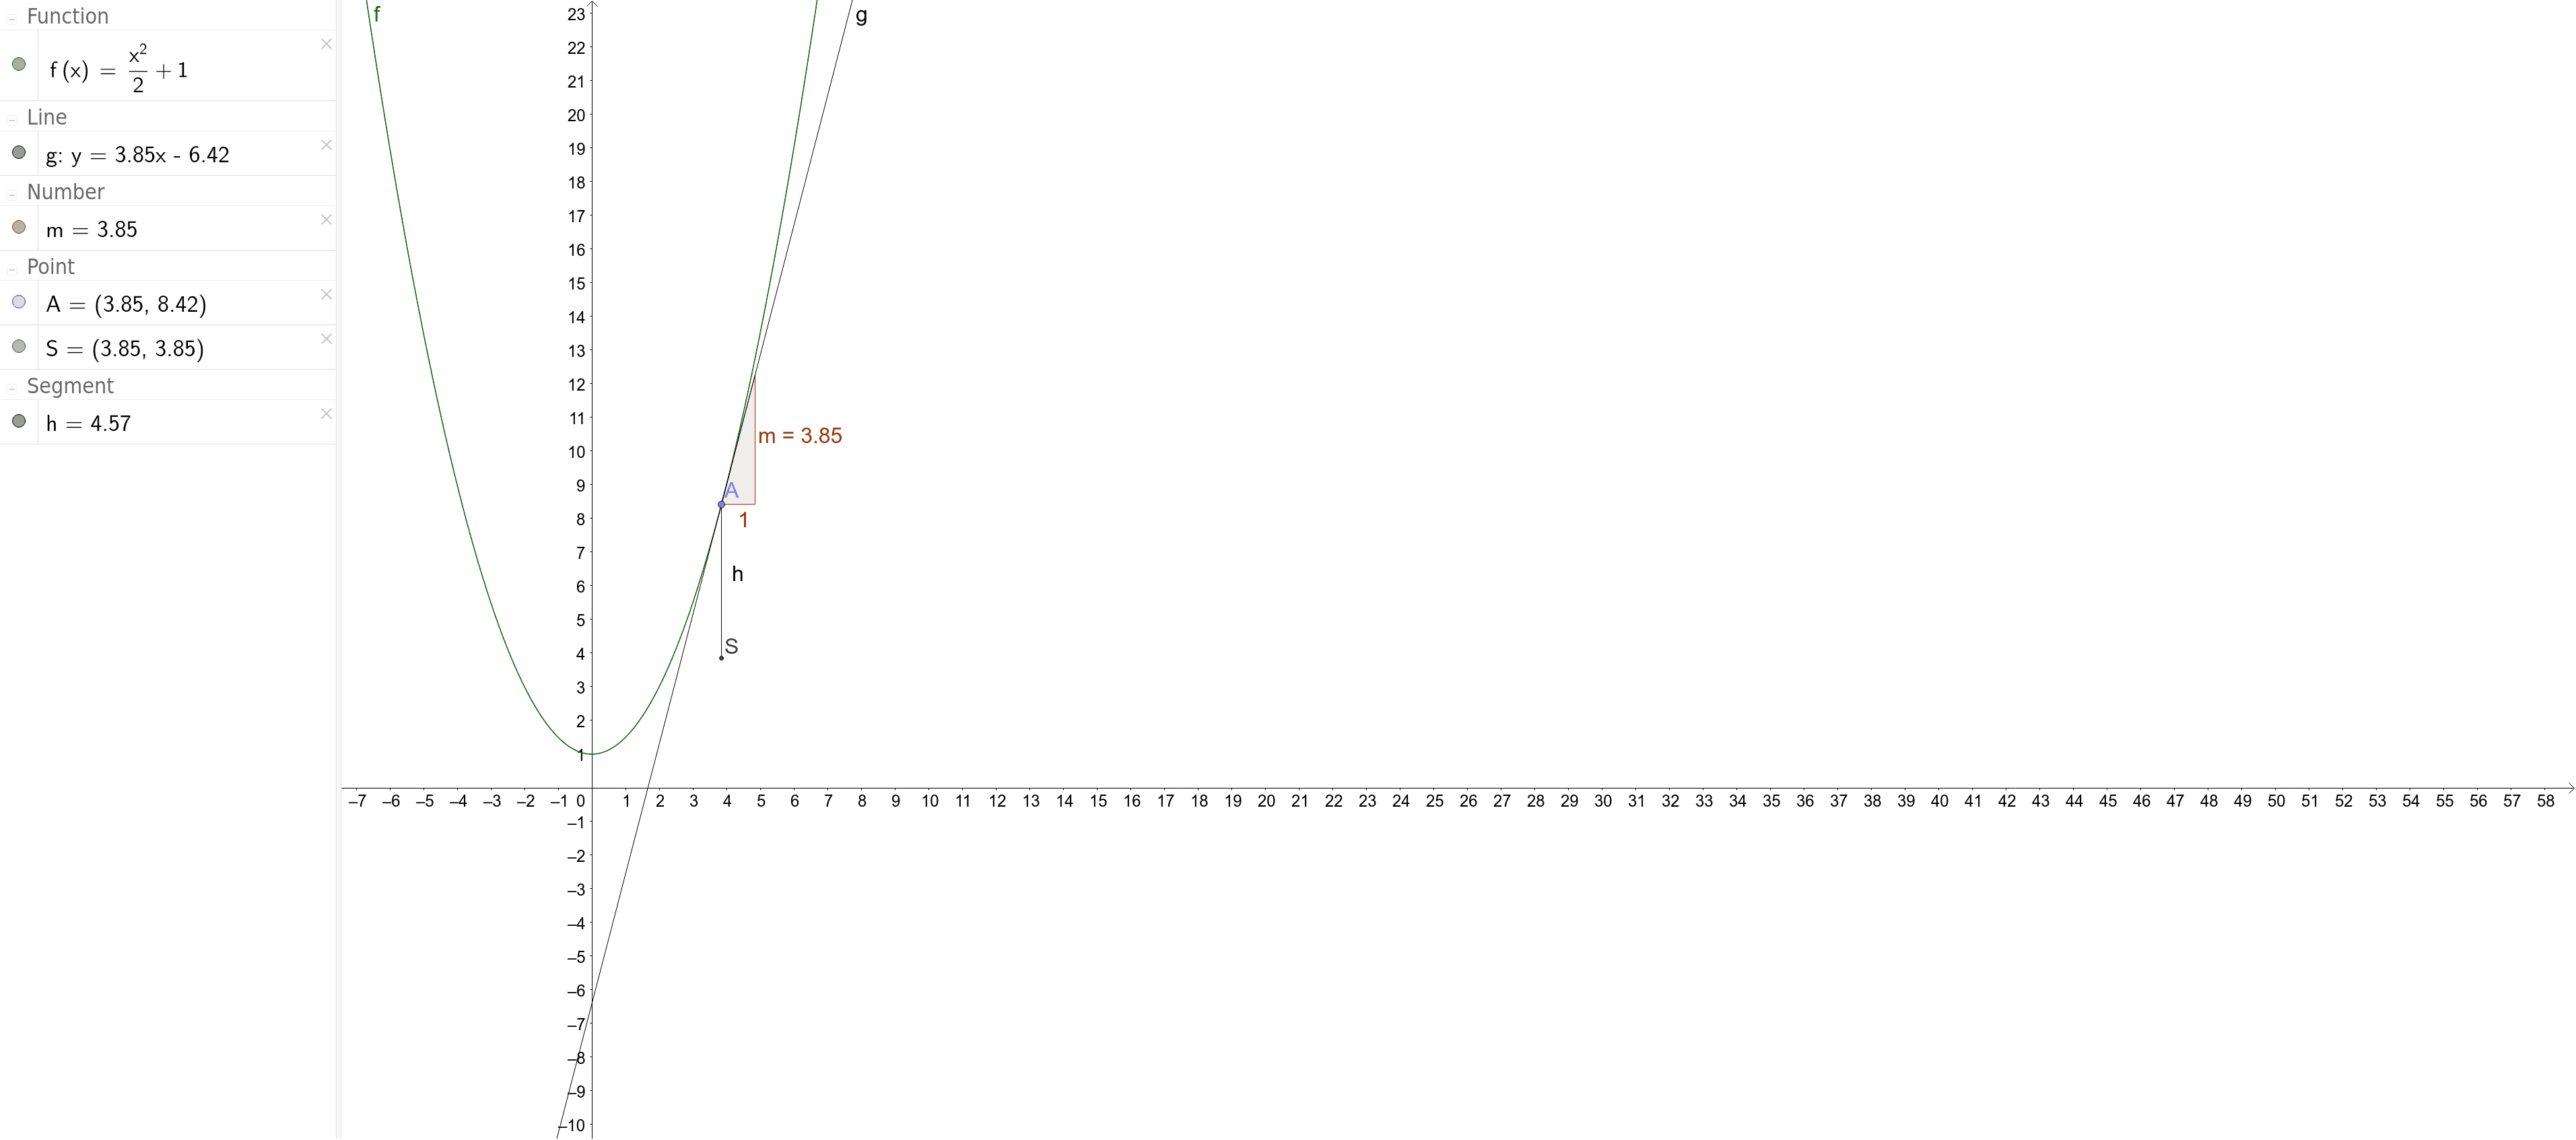
This GeoGebra example dynamically illustrates the connection between the derivative (tangent slope) of a function at a point, histograms, integers, and expected value. The core mathematical concepts include the geometric meaning of derivatives (slope of tangent line), differential calculus, and the statistical concept of expected value. Construction details: the Point command creates a movable point A on the function f, the Tangent command generates the tangent line g at A, the Slope command computes the slope m of the tangent, and the Segment command constructs segments S and h to visualize the slope and its relation to the histogram. Suitable for high school to early college students, this example helps learners grasp the intuitive idea of derivative as an instantaneous rate of change and explore interdisciplinary links between calculus and probability/statistics.
GeoGebra Commands & Parameters
Point(f) → ATangent(A, f) → gSlope(g) → mSegment(S, A) → h