
Derivative Exploration: Tangent Slopes and the Derivative Function
Loading the math board and drawing, please wait…
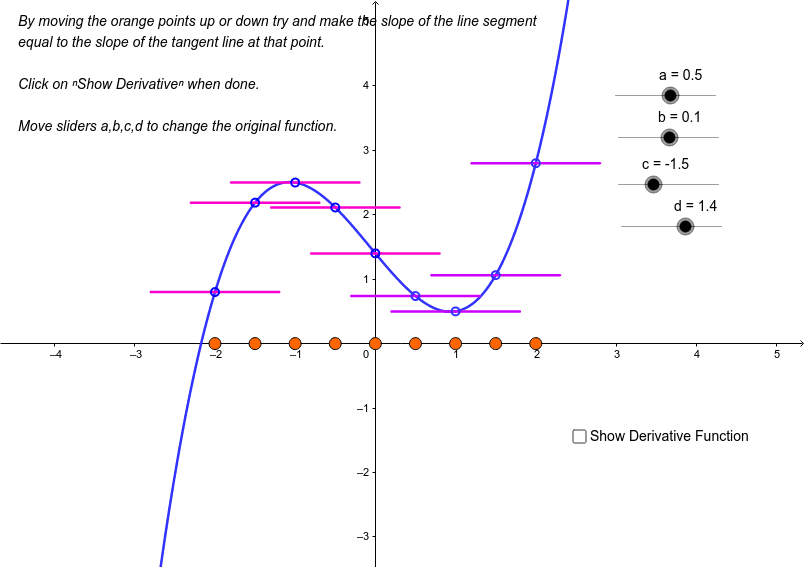
This GeoGebra example dynamically illustrates how the slope of the tangent line to a given function changes at different points, while simultaneously plotting the derivative function. It helps students grasp the geometric meaning of the derivative as an instantaneous rate of change. Core mathematical concepts include the definition of the derivative, tangent line slope, the relationship between a function and its derivative, and the use of similar triangles to visualize slope variations. Construction details: using GeoGebra commands such as Point, Circle, Intersect, Segment, and Derivative, the example builds the original function f, its derivative f', and multiple auxiliary points, segments, and circles. By dragging a point along the curve, learners can observe how the tangent slope corresponds to the value of the derivative. Suitable for high school or introductory college calculus, this resource supports inquiry-based learning and helps students discover connections between the derivative, monotonicity, and extrema.
GeoGebra Commands & Parameters
Point(e) → ACircle(B, 0.8) → kIntersect(j, k, 1) → CIntersect(j, k, 2) → DSegment(C, D) → lDerivative(f) → f'Point(h) → ECircle(F, 0.8) → qIntersect(p, q, 1) → GIntersect(p, q, 2) → HSegment(G, H) → nPoint(g) → ICircle(J, 0.8) → sIntersect(r, s, 1) → MIntersect(r, s, 2) → NSegment(M, N) → tPoint(i) → KCircle(L, 0.8) → c_1Intersect(f_1, c_1, 1) → OIntersect(f_1, c_1, 2) → PSegment(O, P) → a_1Point(b_1) → QCircle(R, 0.8) → k_1Intersect(p_1, k_1, 1) → SIntersect(p_1, k_1, 2) → TSegment(S, T) → i_1Point(d_1) → UCircle(V, 0.8) → r_1Intersect(q_1, r_1, 2) → WIntersect(q_1, r_1, 1) → ZSegment(Z, W) → j_1Point(e_1) → A_1Circle(B_1, 0.8) → t_1Intersect(s_1, t_1, 2) → C_1Intersect(s_1, t_1, 1) → D_1Segment(D_1, C_1) → l_1Point(g_1) → E_1Circle(F_1, 0.8) → c_2Intersect(f_2, c_2, 1) → G_1Intersect(f_2, c_2, 2) → H_1Segment(G_1, H_1) → m_1Point(h_1) → I_1Circle(J_1, 0.8) → d_2Intersect(g_2, d_2, 1) → K_1Intersect(g_2, d_2, 2) → L_1Segment(K_1, L_1) → n_1
AI Drawing Prompt Reference
Draw a dynamic graph showing how the slope of the tangent line to function f changes as a point moves along the curve, while also plotting the derivative function f'. The graph includes the original function curve, the derivative curve, and multiple auxiliary points, circles, and line segments. By dragging a point on the curve, learners can observe the correspondence between the tangent slope and the derivative value. The construction order is: first draw function f and f', then add auxiliary points, circles, and line segments, and finally connect these elements to form a visual geometric relationship.
The prompt above was compiled from the original drawing commands and is for reference only.