
Derivative Definition and Geometric Intuition
Loading the math board and drawing, please wait…
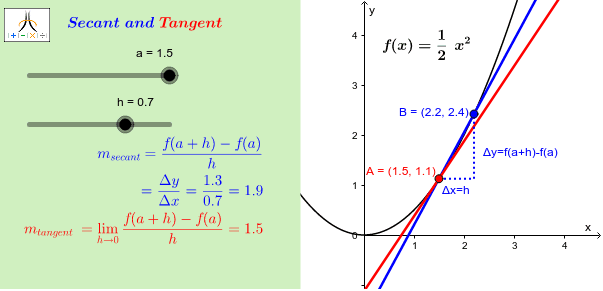
This example demonstrates the concept of derivative through geometric visualization, showing the relationship between the tangent line slope and the rate of change of a function. Key mathematical concepts include derivative, tangent line, slope, and function graphs. Construction involves using GeoGebra commands such as Segment, Line, Slope, Tangent to create tangents, calculate slopes, and visualize the derivative concept. Suitable for high school students or college freshmen to understand the geometric meaning of derivatives and apply in introductory calculus.
GeoGebra Commands & Parameters
Segment(A, C) → ACSegment(C, B) → CBLine(A, B) → SecantSlope(Secant) → slopeTangent(a, f) → TangentCorner(1, 1) → Cnr1Corner(1, 2) → Cnr2Corner(1, 3) → Cnr3Corner(1, 4) → Cnr4Polygon(CN1, CN2, CN3, CN4) → Panel, cn1, cn2, cn3, cn4
AI Drawing Prompt Reference
Draw a function curve on a coordinate plane. Mark three points, with two lying on the curve and one auxiliary point. Connect these points with line segments to form a secant line, and display its slope value. At one of the curve points, construct a tangent line to the function and show its slope. Add a semi-transparent rectangular panel in a corner of the drawing area to display relevant values or notes. The overall layout should clearly illustrate the relationship between the secant slope and the tangent slope, demonstrating the geometric meaning of the derivative as the slope of the tangent line.
The prompt above was compiled from the original drawing commands and is for reference only.