
Derivative as a Function by Junvie Pailden
Loading the math board and drawing, please wait…
In collections
Calculus 1 Graphical Illustrations
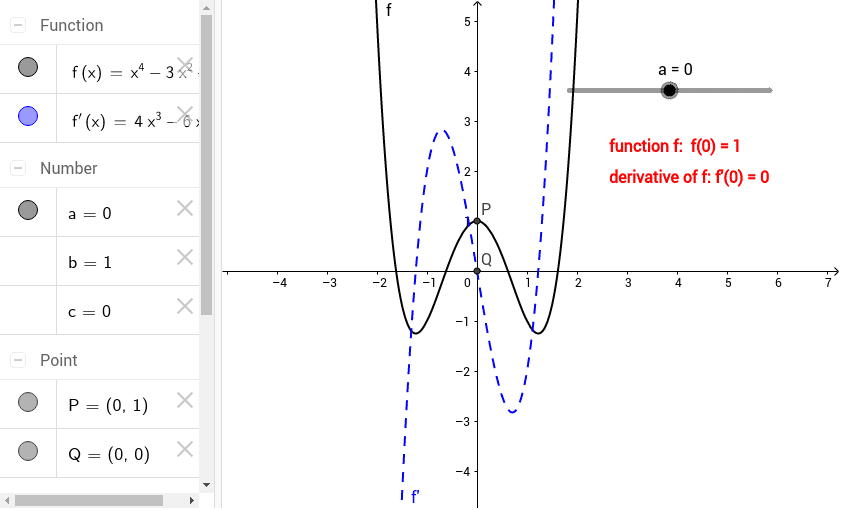
This example demonstrates how to plot a function and its derivative using GeoGebra, visually illustrating the geometric meaning of the derivative. Core math concepts include functions, derivatives, function graphs, and their rates of change. Construction highlights involve objects f, f', a, P, Q, b, c, text1, text2, with sliders to dynamically adjust function parameters and display graphs. Suitable for high school and above students learning calculus to understand derivative concepts and applications.
GeoGebra Commands & Parameters
f(x) = x^(4) - (3 * x^(2)) + 1f'(x) = f'(x)Numeric a(0.0)(a, f(a))(a, f'(a))y(P)y(Q)