
Demonstration of Sine and Cosine Functions
Loading the math board and drawing, please wait…
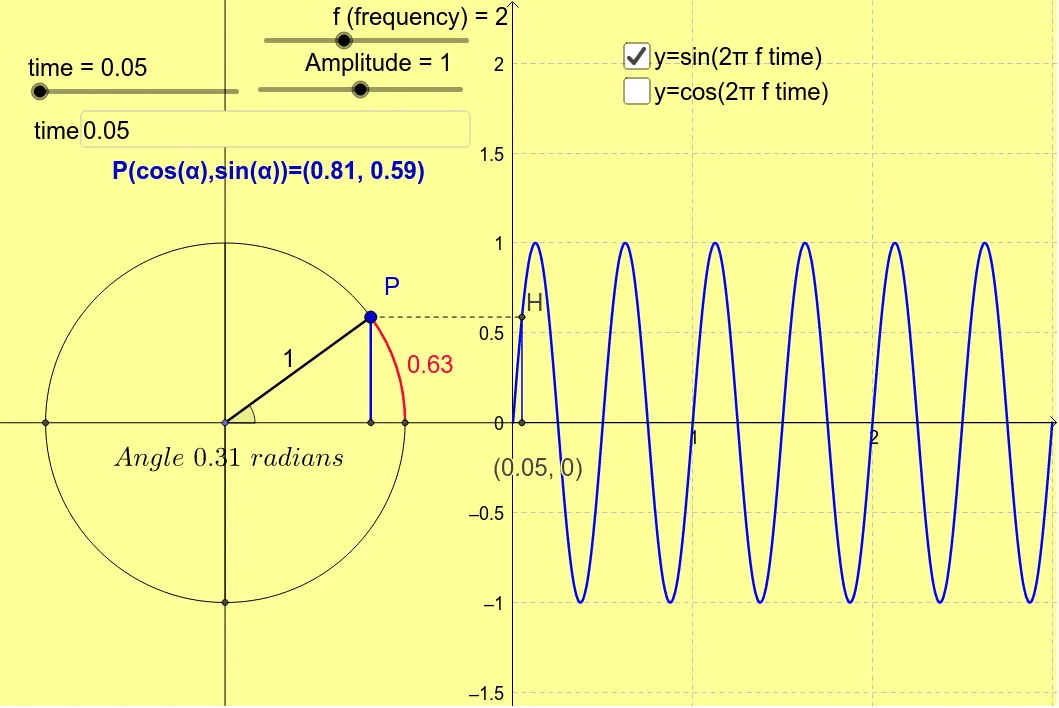
This example dynamically illustrates the graphs of sine and cosine functions along with their corresponding relationships on the unit circle, visually demonstrating the geometric meaning of trigonometric functions. Key math concepts include trigonometric functions, unit circle, angles, amplitude, frequency, etc. It utilizes GeoGebra commands and objects such as Polygon, Point, OrthogonalLine, Line, Intersect, Segment, CircleArc, Angle, and Textfield. Suitable for high school students and learners with basic understanding of trigonometric functions, aiding comprehension of the connection between function graphs and geometric principles.
GeoGebra Commands & Parameters
Polygon(A, B, C, D) → veelhoek1, a_1, b_1, c_1, dPoint(xAxis) → EOrthogonalLine(E, xAxis) → iLine(P, xAxis) → lLine(P, i) → mIntersect(i, l) → JIntersect(m, xAxis) → KSegment(K, P) → nSegment(P, J) → qOrthogonalLine(α_3, xAxis) → rIntersect(l, r) → HIntersect(g, r, (0.05, 0.8090169943749475)) → ISegment(α_3, I) → sSegment(α_3, H) → tSegment(P, H) → f_1Line(E, K) → eOrthogonalLine(E, e) → pIntersect(c, p, 2) → LIntersect(c, p, 1) → MSegment(L, M) → e_1Segment(E, P) → h_1CircleArc(E, G, P) → d_1CircleArc(E, G, P) → αAngle(G, E, P) → γTextfield(time) → InputBox1
AI Drawing Prompt Reference
Draw a unit circle and mark points on it corresponding to the values of sine and cosine functions, showing their relationship on the unit circle. Also plot the graphs of sine and cosine functions, displaying their correspondence with the points on the unit circle. Demonstrate dynamically the concepts of angles, amplitude, and frequency to illustrate the geometric meaning of trigonometric functions, suitable for high school students.
The prompt above was compiled from the original drawing commands and is for reference only.