
Demonstration of Linear Correlation
Loading the math board and drawing, please wait…
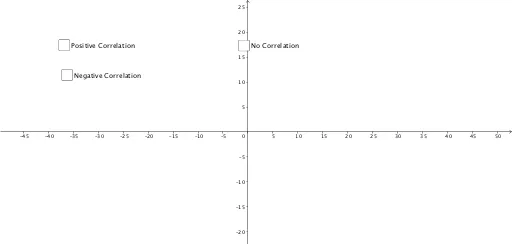
This example dynamically visualizes scatter plots of two datasets to intuitively show positive correlation, negative correlation, and no correlation. Core math concepts include scatter plots, linear correlation coefficients, and correlation judgment. Construction highlights involve point objects (A1-A14, B1-B14), lists (list1, list3), sliders (a, b), and coordinate geometry constructions. Suitable for high school statistics and probability courses to help students understand data distribution and linear relationships.
GeoGebra Commands & Parameters
24570-15791041(A1, B1)(A2, B2)(A3, B3)(A4, B4)(A5, B5)(A6, B6){A, B, C, D, E, F}24570-1755.5410Boolean a(false)9(A9, B9)(A10, B10)(A11, B11)(A12, B12)(A13, B13)(A14, B14){L, M, N, O, P, Q}Boolean b(false)553361438-257396-3842-1
AI Drawing Prompt Reference
Draw scatter plots of two datasets to demonstrate positive, negative, and no correlation. First, create 14 point objects in the coordinate system, then create two lists containing these points. Adjust the positions of the points using sliders to observe changes in the scatter plots and understand the concept of linear correlation coefficients. Finally, adjust sliders a and b to observe changes in the data points and understand data distribution and linear relationships.
The prompt above was compiled from the original drawing commands and is for reference only.