
Demonstrating Minimum Value of Quadratic Functions
Loading the math board and drawing, please wait…
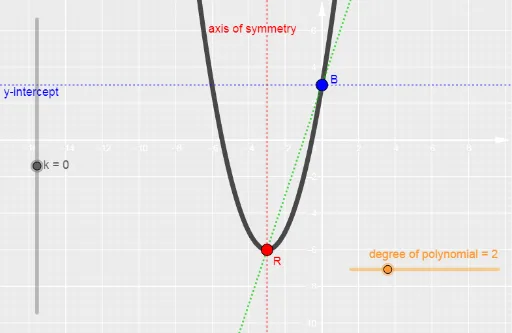
This example illustrates how to graph a quadratic function and find its minimum value point using GeoGebra. Key math concepts include quadratic functions, symmetry axis, vertex coordinates, and function graphing. It leverages commands/objects like k, P_{min}, SymmetryAxis, n, QuadraticCurve, P_{intercept}, yIntercept, f. Suitable for high school students learning quadratic function properties and optimization problems.
GeoGebra Commands & Parameters
Numeric k(0)(-3, (2 * k) - 6)x = -3Numeric n(2)QuadraticCurve(x) = (x + 3)^(n) + (2 * k) - 6(0, 3^(n) + (2 * k) - 6)yIntercept(x) = 3^(n) + (2 * k) - 6f(x) = (3^(n - 1) * x) + 3^(n) + (2 * k) - 6
AI Drawing Prompt Reference
Graph a quadratic function with adjustable exponent and constant, showing its minimum point, symmetry axis, and vertex coordinates. Determine the vertex position first, then draw the function curve, and label the y-intercept and symmetry axis.
The prompt above was compiled from the original drawing commands and is for reference only.