
Definite Integral Demonstration
Loading the math board and drawing, please wait…
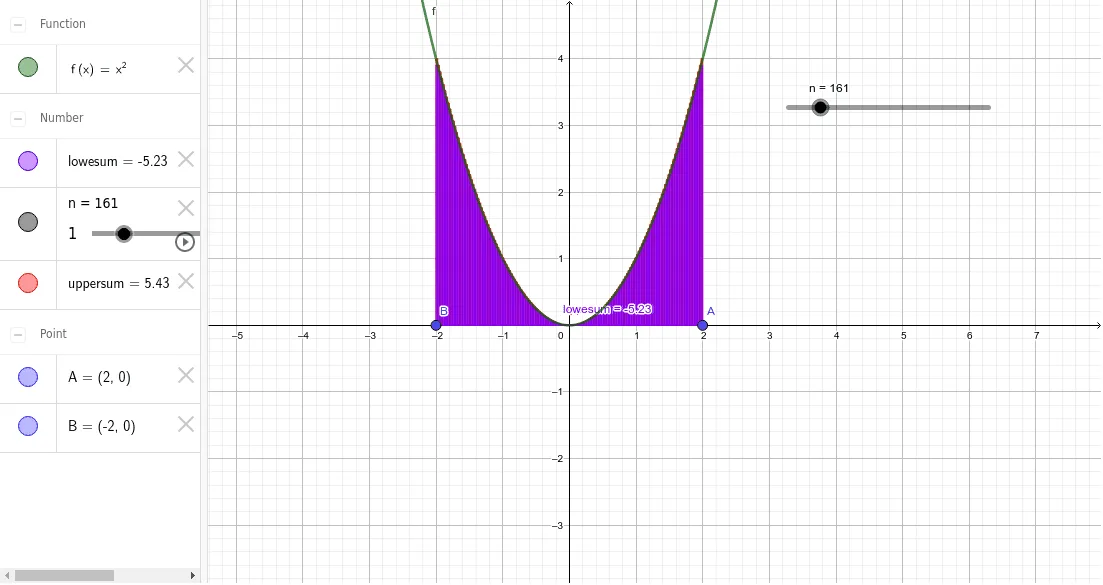
This example demonstrates the concept of definite integrals. By using the UpperSum and LowerSum methods, it provides a visual understanding of the integral calculation process. The construction summary mentions the use of UpperSum and LowerSum commands, which help approximate the value of the definite integral by dividing the interval and calculating the area of each subinterval.
GeoGebra Commands & Parameters
UpperSum(f, x(B), x(A), n) → uppersumLowerSum(f, x(A), x(B), n) → lowesum
AI Drawing Prompt Reference
Draw a function curve over an interval, and illustrate the concept of a definite integral using rectangular approximations. Fill the area between the curve and the x-axis with two sets of rectangles: one set uses the function value at the left endpoint of each subinterval (lower sum), and the other uses the right endpoint (upper sum). Use different colors or transparencies for the two sets to show how they approximate the true area. Mark two points at the interval ends to indicate the integration limits. The visual should convey Riemann sums approaching the integral.
The prompt above was compiled from the original drawing commands and is for reference only.