
Definite Integral -- Accumulated Area
Loading the math board and drawing, please wait…
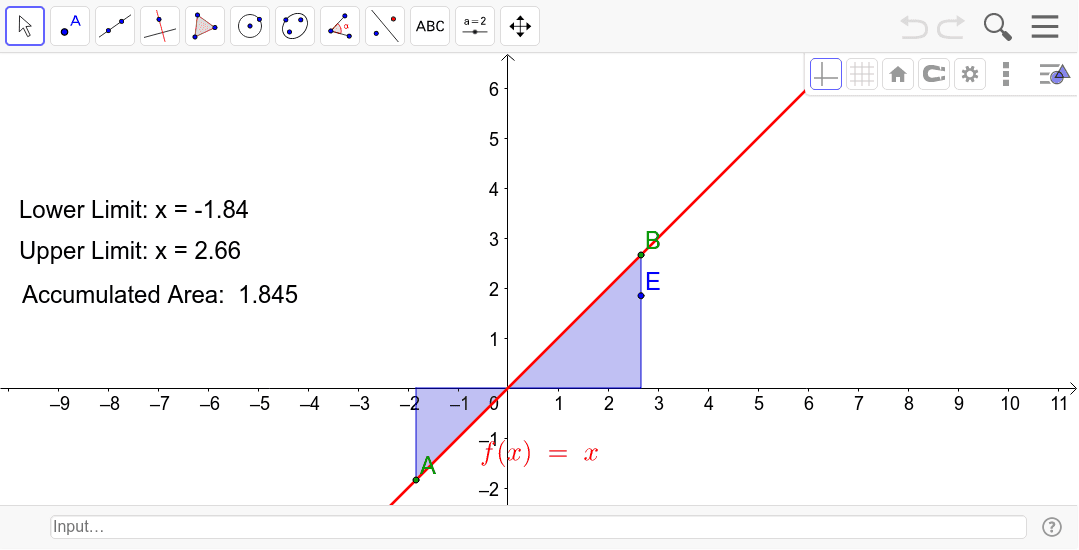
This example illustrates the concept of definite integral by showing how the area under a curve is accumulated over a specific interval. Key mathematical concepts include definite integrals and function graphs. Using GeoGebra commands such as Point, OrthogonalLine, Intersect, and Integral, the process of integration is visually demonstrated. Suitable for high school mathematics education and learning.
GeoGebra Commands & Parameters
Point(f) → BOrthogonalLine(B, xAxis) → bIntersect(b, xAxis) → CPoint(f) → AOrthogonalLine(A, xAxis) → aIntersect(a, xAxis) → DIntegral(f, x(D), x(C)) → d
AI Drawing Prompt Reference
Draw a function curve on a coordinate plane. Select two points on the curve and drop perpendicular lines from each point to the x-axis, marking the intersection points on the axis. Shade the region bounded by the curve, the x-axis, and the two vertical lines between these intersection points, representing the accumulated area under the curve over that interval. Include the curve, the two points, the perpendicular segments, and the shaded area to illustrate the concept of a definite integral.
The prompt above was compiled from the original drawing commands and is for reference only.