
Decimal Fractions Percentages
Loading the math board and drawing, please wait…
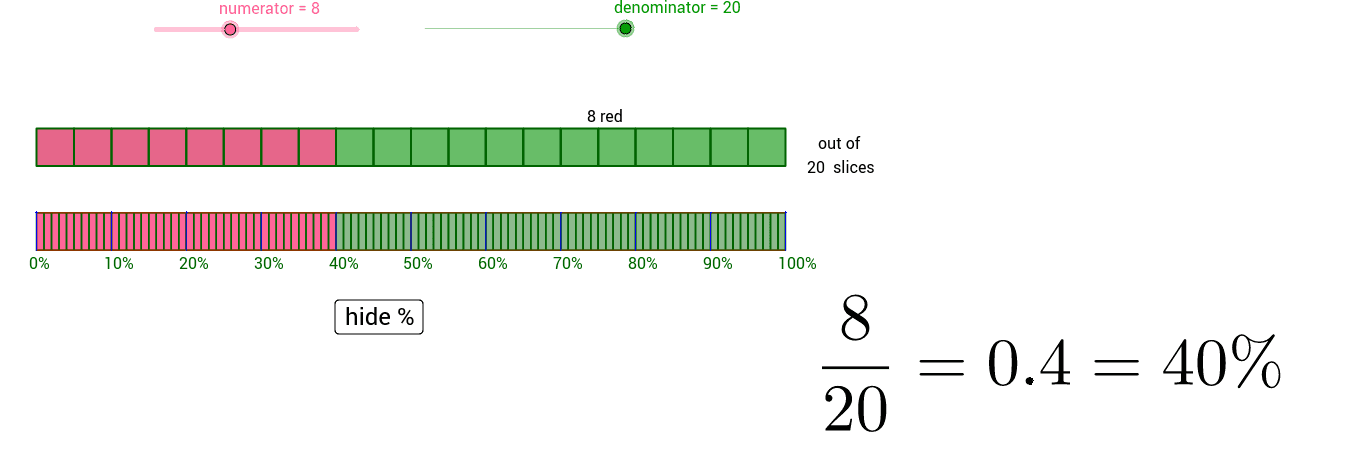
This example demonstrates interactive conversions and visualizations between decimal fractions and percentages, involving core math concepts like decimal operations, fraction representation, percentage calculations, frequency distribution, interest computation, mode, normal distribution, and linear equations. It utilizes GeoGebra commands like sMinMax, Sequence, If, and Polygon, along with objects such as numerator, denominator, dec, and decp, for dynamic data display and geometric constructions. Suitable for middle school and above, focusing on probability & statistics, basic algebra, and geometric constructions.
GeoGebra Commands & Parameters
sMinMax(up, -0.2, 0.2) → red2moveSequence(Polygon[(n, 0), (n, -1), (n + 1, -1), (n + 1, 0)], n, 1, denominator) → green1Sequence(Polygon[(n, -2 - up), (n, -3 - up), (n + slice, -3 - up), (n + slice, -2 - up)], n, 1, denominator + 1 - slice, slice) → green2Sequence(Segment[(n, -2 - up), (n, -3 - up)], n, 1, denominator + 1, (slice * 10)) → ticksSequence(Polygon[(n, 0), (n, -1), (n + 1, -1), (n + 1, 0)], n, 1, numerator) → red1If(numerator > 1, "s", "") → suffixIf(denominator > 1, "s", "") → suffix2Polygon((1, -2 - up), (1, -3 - up), (numerator + 1, -3 - up), (numerator + 1, -2 - up)) → red2, j, k, l, mPolygon((1, -2 - up), (1, -3 - up), (denominator + 1, -3 - up), (denominator + 1, -2 - up)) → green1a, f, g, h, iSequence(Text[((n - 1) * 100 / denominator) + "%", (n - 0.2, -3.5 - up)], n, 1, denominator + 1, (slice * 10)) → ticksnSequence(Polygon[(n, 0), (n, -1), (n + 1, -1), (n + 1, 0)], n, 1, denominator) → green1barSequence(Polygon[(n, -2 - up), (n, -3 - up), (n + slice, -3 - up), (n + slice, -2 - up)], n, 1, denominator + 1 - slice, slice) → green2a
AI Drawing Prompt Reference
Create an interactive chart showing conversions between fractions and percentages. Draw two rows of bars: the top row uses green squares to represent the whole denominator, with the first few squares colored red to indicate the numerator. The bottom row shows a green bar with red overlay for the percentage, including tick marks and percentage labels. Add sliders to adjust numerator and denominator values, updating the display dynamically. Keep the layout clear for educational use.
The prompt above was compiled from the original drawing commands and is for reference only.