
Curve of Intersection of Explicit Surface z=f(x,y) and Cylinder
Loading the math board and drawing, please wait…
In collections
intersection: surface-surface, curve-curve
intersection: surface-surface, curve-curve
intersection: surface-surface, curve-curve
intersection: surface-surface, curve-curve
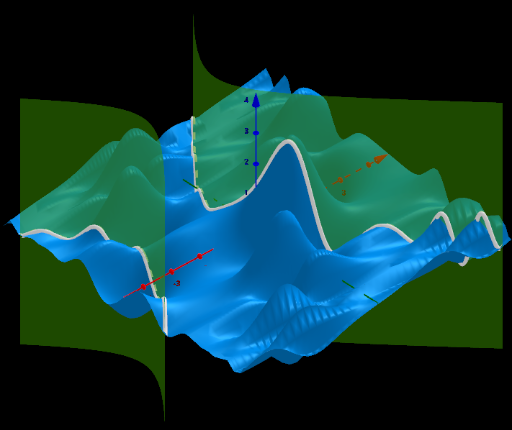
This GeoGebra example visualizes the intersection curve between an explicit surface defined by z=f(x,y) and a cylinder surface in 3D space. It demonstrates how two surfaces intersect along a spatial curve, emphasizing concepts from multivariable calculus and solid geometry, such as parametric representation of curves, surface equations, and the geometric meaning of intersection. The construction uses the CurveCartesian command to generate the intersection curve parametrically, along with Function to define the explicit surface, and interactive elements like sliders, input boxes, and buttons to adjust the cylinder radius, function expression, and viewing angle. It is suitable for university-level calculus or analytic geometry courses, as well as advanced high school students exploring 3D geometry, providing an intuitive visual tool for understanding surface intersections.
GeoGebra Commands & Parameters
Polygon((x_{min}, y_{min}), (x_{max}, y_{min}), (x_{max}, y_{max}), (x_{min}, y_{max})) → Polyg, h, k, m, nPointIn(Polyg) → ATextfield(f) → inputBox3Textfield(x_{min}) → inputBox4Textfield(x_{max}) → inputBox5Textfield(y_{max}) → inputBox6Textfield(z_{max}) → inputBox7Textfield(y_{min}) → inputBox8Textfield(z_{min}) → inputBox9Textfield(zoom_{3D}) → InputBox1CurveCartesian(t, f1yx(t), f1z(t), t, tmin, tmax) → Cu01CurveCartesian(t, f2yx(t), f2z(t), t, tmin, tmax) → Cu02Textfield(v) → InputBox4Function(f(a, b), a, x_{min}, x_{max}, b, y_{min}, y_{max}) → gTextfield(r) → InputBox2
AI Drawing Prompt Reference
Create a 3D plot showing an explicit surface defined by z=f(x,y) over a rectangular domain in the xy-plane. Add a vertical cylinder with adjustable radius r, centered on the z-axis. The intersection of these two surfaces forms a spatial curve, which should be drawn as a parametric curve along the cylinder. Include interactive controls for changing the function expression, the cylinder radius, the coordinate limits, and the 3D viewing angle, so the intersection curve can be explored dynamically.
The prompt above was compiled from the original drawing commands and is for reference only.