
Cumulative Frequency vs Histogram vs Box Plot
Loading the math board and drawing, please wait…
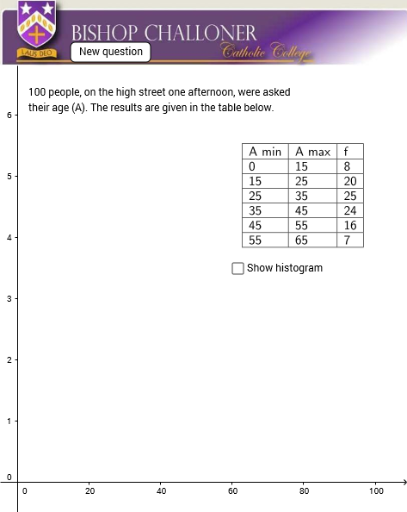
This example demonstrates the construction and comparison of three statistical graphs: cumulative frequency distribution, histogram, and box plot. It involves core math concepts like probability & statistics, data distribution, and five-number summary. GeoGebra commands and objects used include Random, RandomElement, Histogram, CircumcircleArc, Intersect, Segment, Line, TableText. Suitable for high school students and teachers needing to understand data visualization and statistical analysis.
GeoGebra Commands & Parameters
Random(10, 20) → C3Random(10, 20) → C6Random(20, 30) → C4Random(5, 15) → C2Random(5, 15) → C7RandomElement({10, 15, 20}) → D2RandomElement({10, 15}) → D3RandomElement({5, 10}) → D4RandomElement({5, 10}) → D5RandomElement({10, 15}) → D6RandomElement({10, 15, 20}) → D7Histogram({A2, B2, B3, B4, B5, B6, B7}, {E2, E3, E4, E5, E6, E7}) → aCircumcircleArc(G, A, B) → cCircumcircleArc(B, C, D) → dCircumcircleArc(D, E, F) → eIntersect(d, b) → H,Segment(I, H) → fLine(H, yAxis) → gIntersect(g, xAxis) → JSegment(H, J) → hIntersect(e, i, 1) → KIntersect(c, j, 1) → LLine(D, yAxis) → kLine(L, yAxis) → lIntersect(l, xAxis) → MSegment(P, K) → nSegment(O, L) → qSegment(L, M) → rLine(K, yAxis) → pIntersect(p, xAxis) → NSegment(K, N) → sIntersect(d, i) → Q,Line(Q, yAxis) → tIntersect(t, xAxis) → RSegment(P, Q) → a_1Segment(R, Q) → b_1Intersect(d, j) → S,Line(S, yAxis) → c_1Intersect(c_1, xAxis) → TSegment(O, S) → d_1Segment(S, T) → e_1Segment(K, N) → f_1Segment(U, V) → g_1Segment(W, Z) → h_1Segment(B_1, D_1) → i_1Segment(B_1, J_1) → j_1Segment(D_1, K_1) → k_1Segment(F_1, G_1) → l_1Segment(J_1, K_1) → m_1Segment(M_1, N_1) → n_1Segment(O_1, P_1) → p_1Segment(C_1, H_1) → q_1Segment(E_1, I_1) → r_1Segment(C_1, E_1) → s_1Segment(H_1, I_1) → t_1Segment(W, A_1) → a_2Segment(L_1, N_1) → b_2Segment(B_1, H_1) → c_2Segment(D_1, I_1) → d_2Segment(C_1, J_1) → e_2Segment(E_1, K_1) → f_2TableText({{A1, B1, C1}, {A2, B2, C2}, {A3, B3, C3}, {A4, B4, C4}, {A5, B5, C5}, {A6, B6, C6}, {A7, B7, C7}}, "|_") → text1TableText({{A12, B12, C12, D12}, {A13, B13, C13, D13}, {A14, B14, C14, D14}, {A15, B15, C15, D15}, {A16, B16, C16, D16}, {A17, B17, C17, D17}, {A18, B18, C18, D18}}, "|_") → text2TableText({{A20, B20, C20}, {A21, B21, C21}, {A22, B22, C22}, {A23, B23, C23}, {A24, B24, C24}, {A25, B25, C25}, {A26, B26, C26}}, "|_") → text4TableText({{A20, B20, C20, D20}, {A21, B21, C21, D21}, {A22, B22, C22, D22}, {A23, B23, C23, D23}, {A24, B24, C24, D24}, {A25, B25, C25, D25}, {A26, B26, C26, D26}}, "|_") → text5