
Cuboid and Pie Chart Division Demo
Loading the math board and drawing, please wait…
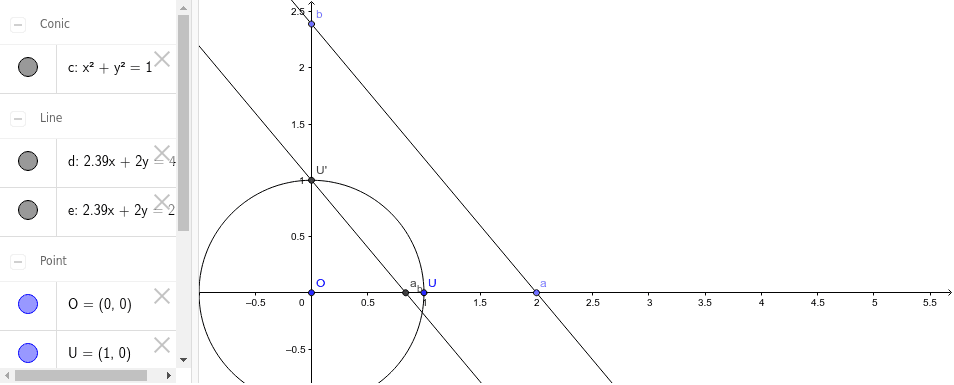
This example demonstrates volume division of a cuboid and its representation in a pie chart. Core math concepts include solid geometry, angles, equations, division, and slope. Construction highlights involve GeoGebra commands like Circle, Intersect, Point, Line, utilizing objects such as O (center), U (point), c (circle), U' (point), a, b, d, e, a_b. Suitable for middle school and above students learning solid geometry and data visualization.
GeoGebra Commands & Parameters
Circle(O, U) → cIntersect(c, yAxis, 2) → U'Point(xAxis) → aPoint(yAxis) → bLine(b, a) → dLine(U', d) → eIntersect(e, xAxis) → a_b
AI Drawing Prompt Reference
Draw a cuboid and represent its volume division with a pie chart beside it. Start by drawing a circle that intersects the y-axis at two points, one of which lies on the x-axis. Connect these two points with a line. Then, draw a line segment from the other intersection point of the circle with the y-axis to this line, which intersects the x-axis at another point. Use a pie chart to visualize the volume proportions of these segments.
The prompt above was compiled from the original drawing commands and is for reference only.