
Critical Values of the Standard Normal Distribution
Loading the math board and drawing, please wait…
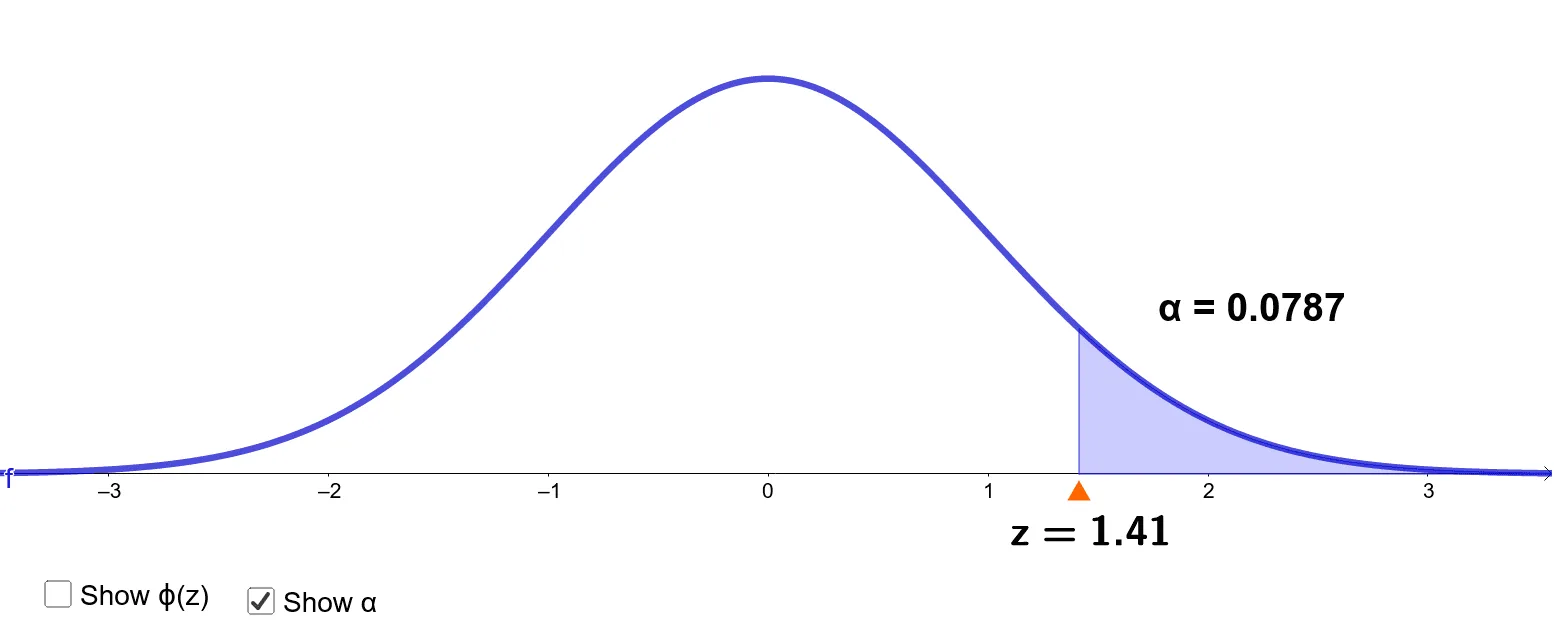
This example illustrates the critical values of the standard normal distribution. Key mathematical concepts include the standard normal distribution in probability and statistics. Construction highlights include using GeoGebra commands Normal to draw the standard normal distribution curve, Line to draw a line, Point to create a point, and Integral to calculate integrals.
GeoGebra Commands & Parameters
Normal(0, 1, x, false) → fLine((0, a), (1, a)) → zlinePoint(zline) → AIntegral(f, zval, 7) → alphaIntegral(f, -6, zval) → phiz
AI Drawing Prompt Reference
Draw the standard normal distribution curve, mark a critical value on the x-axis with a horizontal line, and indicate two integral areas under the curve representing the cumulative probabilities on the left and right sides, with a point marking the position of the horizontal line, showcasing the critical values and integral concepts of the standard normal distribution.
The prompt above was compiled from the original drawing commands and is for reference only.