
Create Quadratic Given Vertex and a Point
Loading the math board and drawing, please wait…
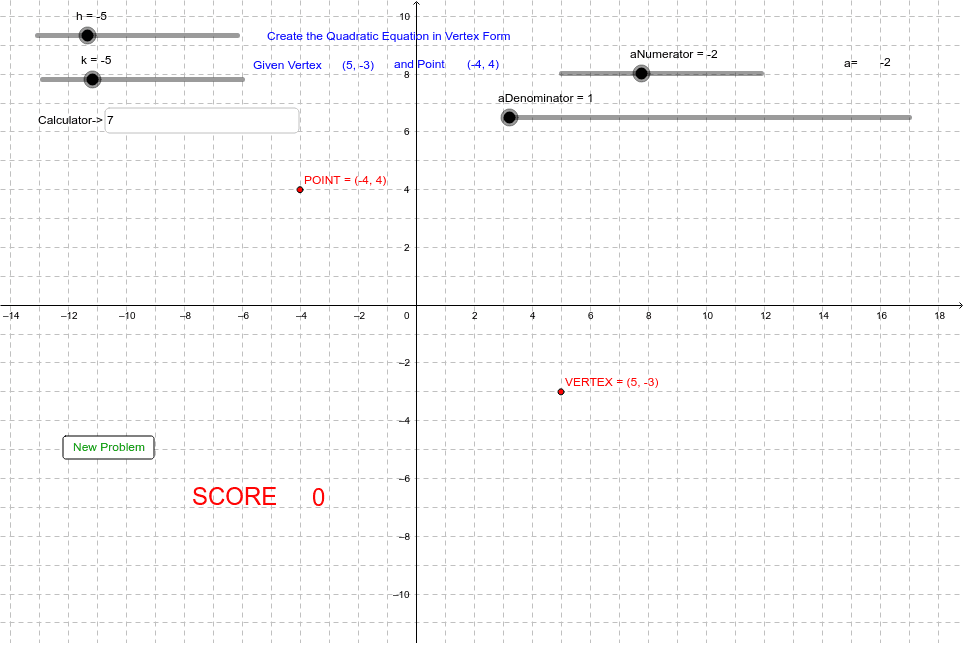
This example demonstrates how to draw a quadratic function graph based on a given vertex and a point. Key math concepts include quadratic functions, vertex coordinates, function formulas, and vector operations. Construction highlights involve using GeoGebra commands like Random, RandomElement, Text, If, and Textfield to calculate parameters a, h, k from input vertex and point coordinates, then plotting the function and auxiliary elements. Suitable for high school students and teachers for learning and demonstration purposes.
GeoGebra Commands & Parameters
Random(-5, 5) → vxrRandom(-5, 5) → vyrRandomElement(aaa) → pyrRandomElement(aaa) → pxrText(Score) → text2If(pxr ≟ vxr, 0, 1) → redoIf(pyr ≟ vyr, 0, 1) → redo2Textfield(Calc) → inputBox1Text(VERTEX) → text4Text(POINT) → text5Text(decimal) → text9
AI Drawing Prompt Reference
Draw a parabola graph. Given the vertex coordinates and a point, calculate the parameters of the parabola, then plot the parabola along with its vertex, point, and auxiliary elements. Ensure the graph is clear, including the vertex, point, parabola curve, and necessary labels.
The prompt above was compiled from the original drawing commands and is for reference only.