
Create a Linear Function
Loading the math board and drawing, please wait…
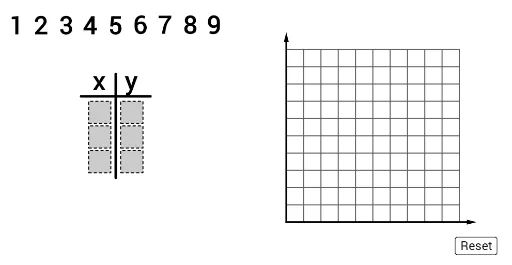
This example demonstrates how to graph a linear function using GeoGebra, covering core concepts like function graphs, coordinate geometry, and vector operations. Key GeoGebra commands and objects used include Polygon, Segment, If, Sequence, Point, Vector, Join, Element, and AreCollinear. Suitable for high school mathematics instruction to understand the properties and construction of linear functions.
GeoGebra Commands & Parameters
Polygon((1.3, 0), (2.2, 0), 4) → poly2Polygon((1.3, 1), (2.2, 1), 4) → poly5Polygon((0, 0), (0.9, 0), 4) → poly1Polygon((0, 1), (0.9, 1), 4) → poly4Polygon((1.3, 2), (2.2, 2), 4) → poly8Polygon((0, 2), (0.9, 2), 4) → poly7Segment(J, K) → aIf(IsInRegion[A, poly8], 1, If[IsInRegion[B, poly8], 2, If[IsInRegion[C, poly8], 3, If[IsInRegion[D, poly8], 4, If[IsInRegion[E, poly8], 5, If[IsInRegion[F, poly8], 6, If[IsInRegion[G, poly8], 7, If[IsInRegion[H, poly8], 8, If[IsInRegion[I, poly8], 9, 0]]]]]]]]) → y1If(IsInRegion[A, poly7], 1, If[IsInRegion[B, poly7], 2, If[IsInRegion[C, poly7], 3, If[IsInRegion[D, poly7], 4, If[IsInRegion[E, poly7], 5, If[IsInRegion[F, poly7], 6, If[IsInRegion[G, poly7], 7, If[IsInRegion[H, poly7], 8, If[IsInRegion[I, poly7], 9, 0]]]]]]]]) → x1If(IsInRegion[A, poly5], 1, If[IsInRegion[B, poly5], 2, If[IsInRegion[C, poly5], 3, If[IsInRegion[D, poly5], 4, If[IsInRegion[E, poly5], 5, If[IsInRegion[F, poly5], 6, If[IsInRegion[G, poly5], 7, If[IsInRegion[H, poly5], 8, If[IsInRegion[I, poly5], 9, 0]]]]]]]]) → y2If(IsInRegion[A, poly4], 1, If[IsInRegion[B, poly4], 2, If[IsInRegion[C, poly4], 3, If[IsInRegion[D, poly4], 4, If[IsInRegion[E, poly4], 5, If[IsInRegion[F, poly4], 6, If[IsInRegion[G, poly4], 7, If[IsInRegion[H, poly4], 8, If[IsInRegion[I, poly4], 9, 0]]]]]]]]) → x2If(IsInRegion[A, poly2], 1, If[IsInRegion[B, poly2], 2, If[IsInRegion[C, poly2], 3, If[IsInRegion[D, poly2], 4, If[IsInRegion[E, poly2], 5, If[IsInRegion[F, poly2], 6, If[IsInRegion[G, poly2], 7, If[IsInRegion[H, poly2], 8, If[IsInRegion[I, poly2], 9, 0]]]]]]]]) → y3If(IsInRegion[A, poly1], 1, If[IsInRegion[B, poly1], 2, If[IsInRegion[C, poly1], 3, If[IsInRegion[D, poly1], 4, If[IsInRegion[E, poly1], 5, If[IsInRegion[F, poly1], 6, If[IsInRegion[G, poly1], 7, If[IsInRegion[H, poly1], 8, If[IsInRegion[I, poly1], 9, 0]]]]]]]]) → x3Sequence(Point[{i + 0.1, 6}], i, -3, 5) → anchorsSegment((1.1, -0.2), (1.1, 4)) → fPoint({8, -2}) → fakeOriginSequence(Segment[fakeOrigin + ((gridSpacer * i), 0), fakeOrigin + ((gridSpacer * i), (10 * gridSpacer))], i, 1, 10) → verLinesSequence(Segment[fakeOrigin + (0, (gridSpacer * i)), fakeOrigin + ((gridSpacer * 10), (i * gridSpacer))], i, 1, 10) → horLinesVector(fakeOrigin, fakeOrigin + ((11 * gridSpacer), 0)) → xaxisVector(fakeOrigin, fakeOrigin + (0, (11 * gridSpacer))) → yaxisJoin({Sequence[(fakeOrigin * (1 - i / 300)) + ((x(point2anchor), y(fakeOrigin)) * i / 300), i, 0, 300], Sequence[((x(point2anchor), y(fakeOrigin)) * (1 - i / 300)) + (point2anchor * i / 300), i, 0, 300]}) → path2Element(path2, timer2) → mover2AreCollinear(point1anchor, point2anchor, point3anchor) → linePolygon((-0.3, -0.3), (2.5, -0.3), (2.5, 3.2), (-0.3, 3.2)) → region, h, i, j, kJoin({Sequence[(fakeOrigin * (1 - i / 300)) + ((x(point3anchor), y(fakeOrigin)) * i / 300), i, 0, 300], Sequence[((x(point3anchor), y(fakeOrigin)) * (1 - i / 300)) + (point3anchor * i / 300), i, 0, 300]}) → path3Element(path3, timer3) → mover3Join({Sequence[(fakeOrigin * (1 - i / 300)) + ((x(point1anchor), y(fakeOrigin)) * i / 300), i, 0, 300], Sequence[((x(point1anchor), y(fakeOrigin)) * (1 - i / 300)) + (point1anchor * i / 300), i, 0, 300]}) → path1Element(path1, timer1) → mover1If(¬firstCheck, Line[mover1, mover2], Line[newMover1, newMover2]) → gPoint({x(fakeOrigin) - gridSpacer, g(x(fakeOrigin) - gridSpacer)}) → leftBoundPoint({x(fakeOrigin) + (11 * gridSpacer), g(x(fakeOrigin) + (11 * gridSpacer))}) → rightBoundIf(¬firstCheck, Vector[mover1, leftBound], Vector[newMover1, leftBound]) → uIf(¬firstCheck, Vector[mover1, rightBound], Vector[newMover1, rightBound]) → vIf(¬firstCheck, timer3 ≟ Length[path3], checkedTimer ≟ 1) → ready
AI Drawing Prompt Reference
Draw a graph of a linear function with multiple square grids. Connect points based on their positions within specific regions to form line segments, showcasing the function's graph. Start by creating horizontal and vertical square grids. Then, determine and connect points to form the function's graph. Finally, add coordinate axes and boundary points to complete the illustration.
The prompt above was compiled from the original drawing commands and is for reference only.