
Counting with Venn Diagrams
Loading the math board and drawing, please wait…
In collections
Venn Diagrams
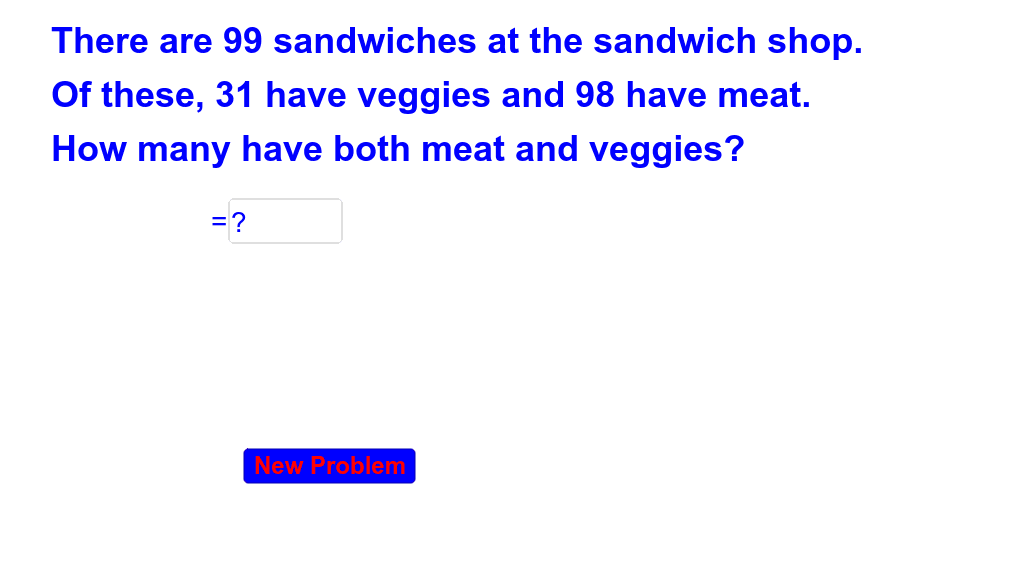
This example demonstrates how to use Venn diagrams for counting sets, involving core math concepts like set operations, probability & statistics, and logical reasoning. It is constructed using GeoGebra commands such as Random, Textfield, RandomElement, and If, making it suitable for high school students learning set theory and probability statistics.
GeoGebra Commands & Parameters
Random(1, 100) → bRandom(1, 100) → cRandom(1, Min[c, b]) → c2Textfield(ans) → inputBox1RandomElement({"Not Quite", "Try Again"}) → eresIf(ans ≟ c2, true, false) → acorRandomElement({"Good Job", "Great!", "Way to Go!", "Awesome"}) → text5
AI Drawing Prompt Reference
Generate two sets with random sizes and calculate their intersection. Show two circles representing sets, with the intersection area colored differently. Display encouraging text based on whether the intersection equals the smaller input value. Draw the circles first, fill the intersection, then show the text based on the condition.
The prompt above was compiled from the original drawing commands and is for reference only.