
Cosine Wave Function Demo
Loading the math board and drawing, please wait…
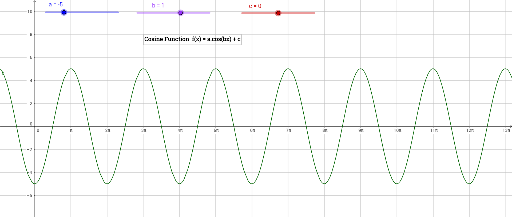
This example demonstrates the cosine wave function in two-dimensional space, including its graph and variation patterns. Core mathematical concepts involve the cosine function, 2D vectors, angles, indefinite integral, line segments, and bar charts. Construction highlights utilize GeoGebra objects a, b, c, text1, and f, where a, b, c might represent parameters, text1 is a text annotation, and f is a function object. Suitable for high school students learning trigonometry, analytical geometry, and calculus, helping them understand function graph plotting and the impact of parameters on function shapes.
GeoGebra Commands & Parameters
Numeric a(-5)Numeric b(1)Numeric c(0)f(x) = (a * cos((b * x))) + c
AI Drawing Prompt Reference
Draw the cosine function graph in 2D space, showing its wave pattern and variations. Include parameters a, b, c to control the amplitude, frequency, and vertical shift of the wave, with annotations for their values. Plot the function graph and display the wave shape changes caused by parameter variations.
The prompt above was compiled from the original drawing commands and is for reference only.