
Cosine Curve by shane.williams
Loading the math board and drawing, please wait…
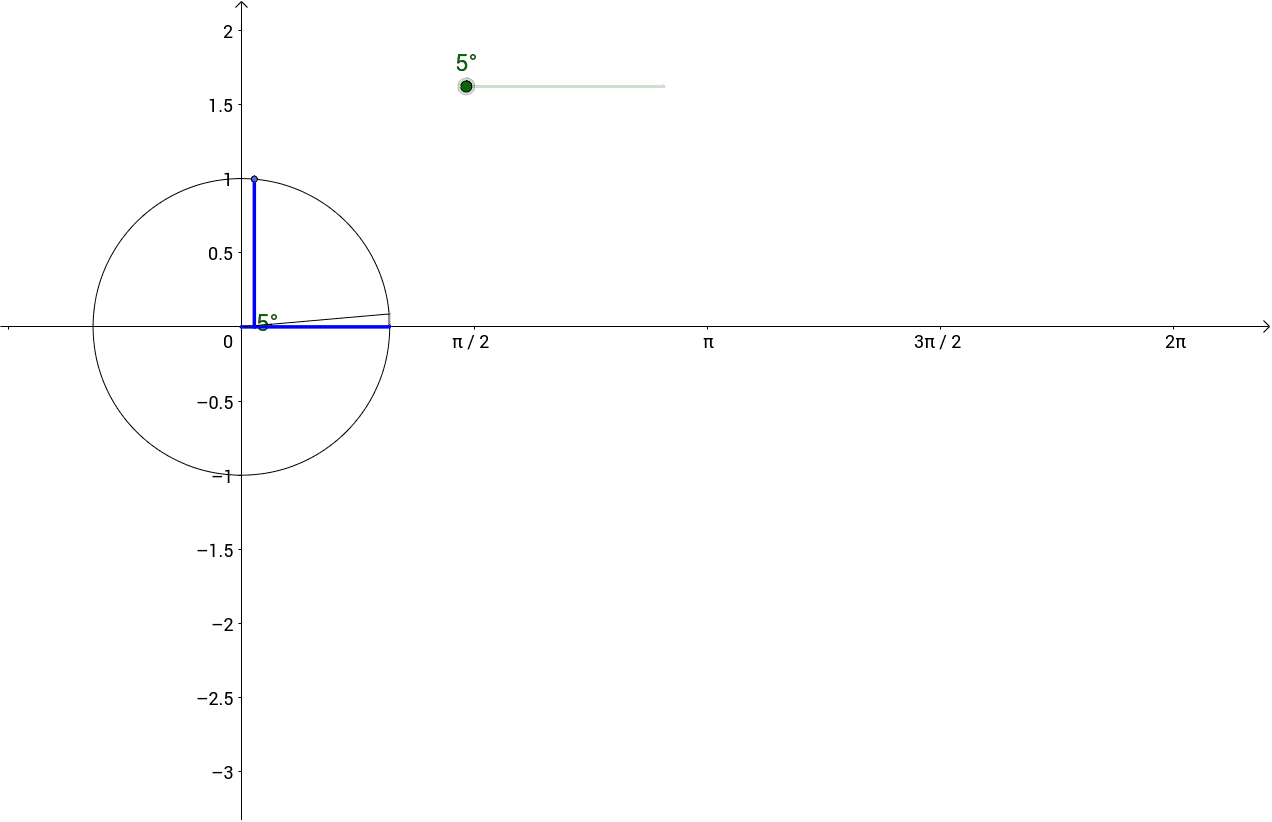
This example demonstrates the graph of the cosine function and its fundamental properties. Key math concepts include trigonometry, periodicity, amplitude, and analytical geometry. Construction highlights involve using GeoGebra commands/objects like Point, Rotate, Angle, and Segment. Suitable for high school students learning to plot and understand the properties of trigonometric function graphs.
GeoGebra Commands & Parameters
Point(c) → APoint(xAxis) → BRotate(A, a, B) → A'Angle(A, B, A') → αSegment(D, C) → bSegment(E, A') → dSegment(B, E) → eSegment(B, A') → fSegment(F, C) → g
AI Drawing Prompt Reference
Draw the graph of a cosine function to demonstrate its fundamental properties, including periodicity, amplitude, and analytical geometry relationships. Start by plotting the coordinate axes, then determine a point and rotate it around the x-axis to get another point, measuring the rotation angle. Next, draw line segments through these points to construct the cosine wave, labeling the lengths of key segments to highlight the geometric features of the function's graph.
The prompt above was compiled from the original drawing commands and is for reference only.