
Correlation Experimentation: Strong vs Weak Relationships
Loading the math board and drawing, please wait…
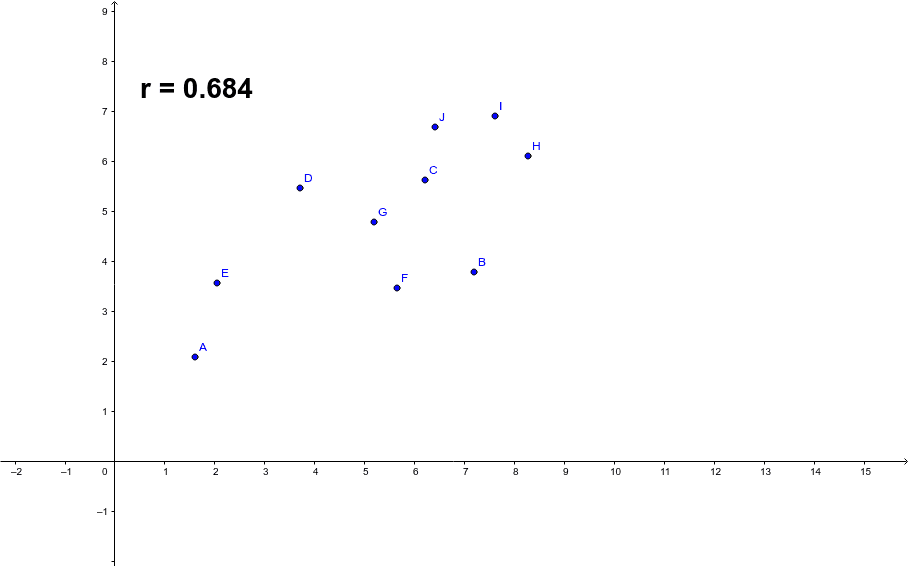
① This example demonstrates the visual difference between strong and weak correlations using scatter plots and a fitted line, allowing learners to grasp the meaning of correlation coefficients intuitively. ② The core mathematical concept is the Pearson product-moment correlation coefficient (PMCC), which quantifies the strength and direction of a linear relationship between two variables, ranging from -1 to 1, with values closer to ±1 indicating stronger correlation. ③ Construction details: The GeoGebra command PMCC is used to compute the correlation coefficient; points A through J serve as data samples; the variable r stores the coefficient value; and text1 dynamically displays the coefficient on the canvas, enabling real-time observation as data points are manipulated. ④ Suitable for high school or introductory college statistics, as well as math lab activities or inquiry-based learning, helping students distinguish between strong and weak, positive and negative correlations.
GeoGebra Commands & Parameters
PMCC({A, B, C, D, E, F, G, H, I, J}) → r
AI Drawing Prompt Reference
Create a scatter plot with ten data points that roughly follow a linear trend with some random scatter. Add a fitted line to show the overall direction. Display a numeric label on the canvas representing the correlation coefficient, ranging from -1 to 1, indicating how closely the points cluster around the line. Allow the points to be moved so the coefficient updates, helping to visualize strong versus weak and positive versus negative correlations.
The prompt above was compiled from the original drawing commands and is for reference only.