
Correlation Coefficient and Line of Best Fit by Terry Lee Lindenmuth
Loading the math board and drawing, please wait…
In collections
AP Statistics
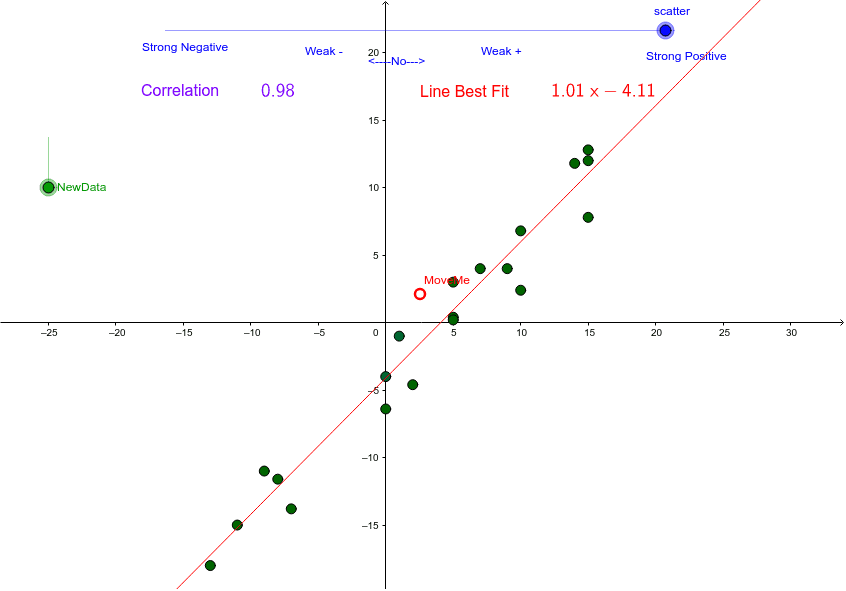
This example demonstrates scatter plots and the line of best fit by moving data points and scatter sliders. Key mathematical concepts include correlation coefficient and linear regression. Commands used include If, Random, FitPoly, PMCC, etc. Suitable for high school math education and learning.
GeoGebra Commands & Parameters
If(scatter ≟ 0, 10.5, 1 / ((5 * scatter))) → recipRandom(-5, 5) → bRandom(-15, 15) → aRandom(-15, 15) → fRandom(-15, 15) → cRandom(-15, 15) → dRandom(-15, 15) → eRandom(-15, 15) → hRandom(-15, 15) → iRandom(-15, 15) → jRandom(-15, 15) → kRandom(-15, 15) → lRandom(-15, 15) → nRandom(-15, 15) → oRandom(-15, 15) → pRandom(-15, 15) → qRandom(-15, 15) → rRandom(-15, 15) → sRandom(-15, 15) → tRandom(-15, 15) → uRandom(-15, 15) → vRandom(-15, 15) → wRandom(0, 1) → sgIf(sg ≟ 0, -1, 1) → plmnFitPoly(Z, 1) → ZZPMCC(Z) → CORRLaTeX(CORR) → text1LaTeX(ZZ) → text4
AI Drawing Prompt Reference
Create a scatter plot with randomly generated data points and display the line of best fit. Use sliders to control the distribution of the scatter plot and calculate the correlation coefficient. The data points are randomly generated, the line of best fit is calculated through all data points, and the correlation coefficient is calculated based on the linear relationship of the data points and displayed on the plot.
The prompt above was compiled from the original drawing commands and is for reference only.