
Correlation Analysis and Chart Visualization
Loading the math board and drawing, please wait…
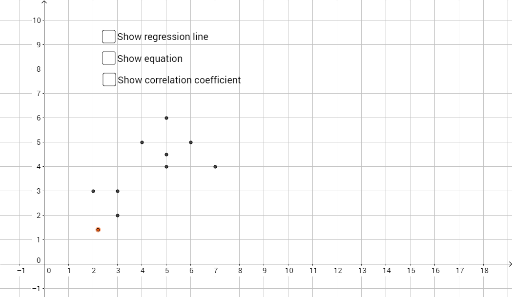
This example demonstrates how to perform correlation analysis and visualize data using pie charts and geometric objects in GeoGebra. Key math concepts include PMCC (Pearson's correlation coefficient), hypothesis testing, probability distributions, and geometric constructions. The construction involves commands like FitPoly for trend line fitting, PMCC for correlation calculation, and geometric objects such as cuboids and parallelograms, along with sliders and loci. Suitable for high school and above, this serves as a case study integrating probability statistics with coordinate geometry.
GeoGebra Commands & Parameters
FitPoly(list1, 1) → fPMCC(list1) → r
AI Drawing Prompt Reference
Create a scatter plot with a set of data points, and add a fitted straight line through them to show the trend. Also, display the correlation coefficient value near the chart to indicate the linear relationship strength. The overall image should include axes, data points, the trend line, and the correlation coefficient label, with a clean and clear style suitable for statistics teaching.
The prompt above was compiled from the original drawing commands and is for reference only.