
Continuous or not at 2?
Loading the math board and drawing, please wait…
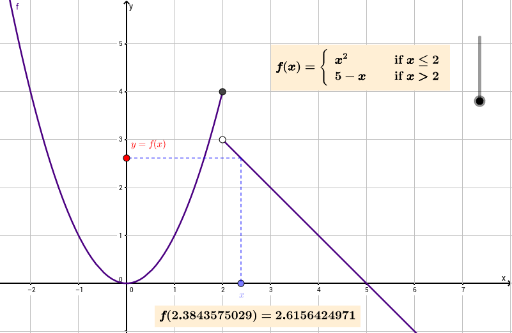
This example demonstrates how to determine if a function is continuous at a specific point. The key mathematical concept involved is the continuity of functions. Using GeoGebra commands such as Point and Segment, the function graph is constructed and its behavior at a particular point is observed. Suitable for high school math education or learning.
GeoGebra Commands & Parameters
Point(xAxis) → CSegment(D, E) → hSegment(F, C) → i
AI Drawing Prompt Reference
Draw a coordinate plane with a movable point on the x-axis, representing a position near x=2. From this point, draw a line segment to another point on the function curve, showing the function value at that location. Also draw a horizontal segment connecting two distinct points on the curve, to illustrate whether the function has a jump or break at x=2. The overall figure is used to examine continuity at x=2, emphasizing the function values and segment connections near that point.
The prompt above was compiled from the original drawing commands and is for reference only.