
Constructing Venn Diagrams with Intersecting Circles
Loading the math board and drawing, please wait…
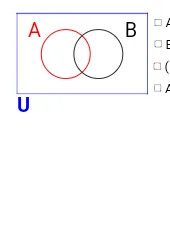
This example demonstrates how to visualize set relationships—intersection, union, and differences—by drawing intersecting circles and highlighting the corresponding regions. It focuses on the mathematical idea of representing sets with geometric areas, making it easy to see which elements belong to which combinations of sets. The key concepts include sets (via intersection and union) and the mapping between logical set operations and the geometry of overlapping regions. Construction in GeoGebra uses Point and Circle to create the required circle centers and circles, Intersect to compute their intersection points, CircleArc and CircumcircleArc to draw the curved boundaries of each region, and Polygon to form or outline the relevant area shapes, with text1/text2 for set labels. The listed objects (points, arcs, and polygonal regions such as poly4) are used to build the full diagram with clear region delineation. Suitable for middle school to early university teaching, especially in set theory and probability/statistics event visualization.
GeoGebra Commands & Parameters
Point(xAxis) → ECircle(E, 3) → ePoint(xAxis) → FCircle(F, 3) → fIntersect(e, f) → G, H, ,CircleArc(F, G, H) → gCircleArc(E, H, G) → hCircle(F, 3) → kCircle(E, 3) → pPoint(e) → APoint(f) → RCircumcircleArc(G, A, H) → sCircleArc(F, G, H) → tCircumcircleArc(G, R, H) → e_1CircleArc(E, H, G) → f_1Polygon(I, L, K, J) → poly4, i_1, l_1, k_1, j_1Circle(F, 2.95) → g_1Circle(E, 2.95) → h_1CircleArc(F, G, H) → q_1CircleArc(E, H, G) → r_1
AI Drawing Prompt Reference
Draw a Venn diagram consisting of two intersecting circles. The intersection points are labeled G and H. Circle arcs g, h, t, q1, and r1 outline the overlapping regions. The polygon poly4 defines specific areas. Text labels text1 and text2 annotate set names. The diagram clearly illustrates set relationships such as intersection, union, and differences, suitable for mathematical teaching and probability/statistics visualization.
The prompt above was compiled from the original drawing commands and is for reference only.