
Constructing a Market Demand Curve by Horizontal Addition of Three Individual De
Loading the math board and drawing, please wait…
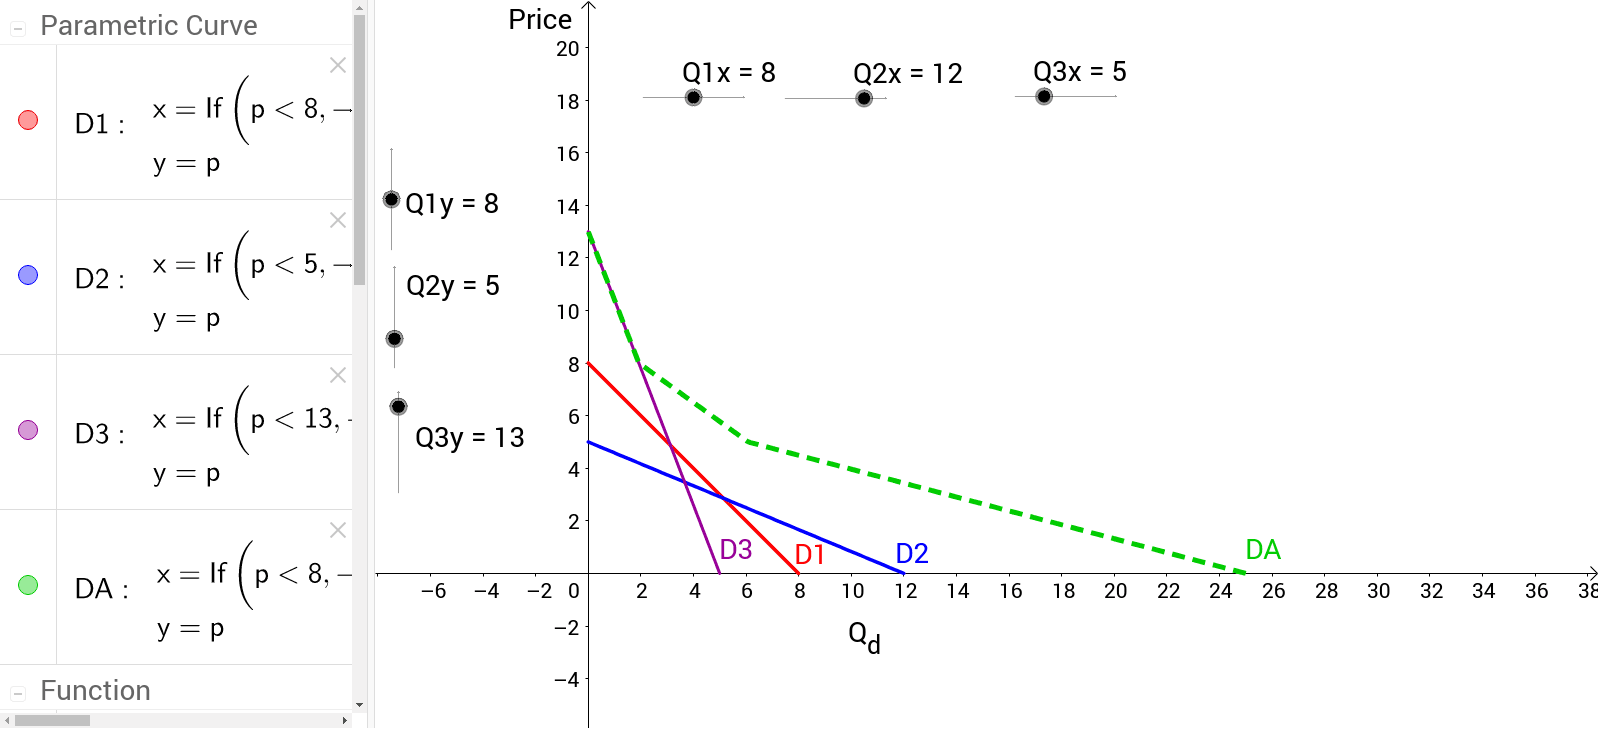
This example shows how to construct a market demand curve by horizontally adding three individual demand curves. It involves key mathematical concepts such as demand functions, horizontal summation, coordinate geometry, and piecewise function graphing. In GeoGebra, the construction uses the CurveCartesian command and an If statement; objects Q1x/Q1y, Q2x/Q2y, Q3x/Q3y define the individual demand curves, D1, D2, D3 plot them, g performs the horizontal addition, text1 and text2 label the result, and DA computes the area under the curve. The activity is suitable for high‑school (advanced mathematics/economics) and early university students.
GeoGebra Commands & Parameters
If(x < Q2y, (-Q2x) / Q2y * (x - Q2y), 0) → Q2If(x < Q3y, (-Q3x) / Q3y * (x - Q3y), 0) → Q3If(x < Q1y, (-Q1x) / Q1y * (x - Q1y), 0) → Q1CurveCartesian(Q1(p), p, p, 0, Q1y) → D1CurveCartesian(Q2(p), p, p, 0, Q2y) → D2CurveCartesian(Q3(p), p, p, 0, Q3y) → D3CurveCartesian(g(p), p, p, 0, Max[Q1y, Max[Q2y, Q3y]]) → DA