
Connecting Equations to Graphs (Part 2)
Loading the math board and drawing, please wait…
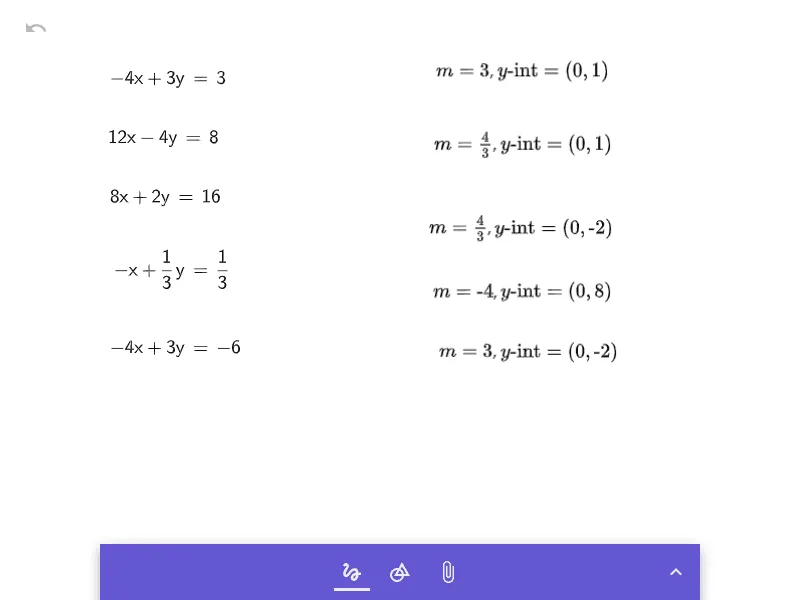
This example demonstrates how to change the graph by adjusting parameters a, b, c, d, and e, illustrating the relationship between equations and their corresponding graphs. Using slider animation, students can intuitively understand the impact of parameter changes on the graph. Mainly uses GeoGebra's slider animation feature. Suitable for middle school math education to help students understand the connection between equations and graphs.
GeoGebra Commands & Parameters
Formula aFormula bFormula cFormula dFormula e
AI Drawing Prompt Reference
Draw a function graph that changes dynamically by adjusting five parameters a, b, c, d, e using slider animations, showing the impact of parameter changes on the graph, and visually demonstrating the relationship between equations and their graphs, suitable for middle school math education.
The prompt above was compiled from the original drawing commands and is for reference only.