
Confidence Intervals for Proportions
Loading the math board and drawing, please wait…
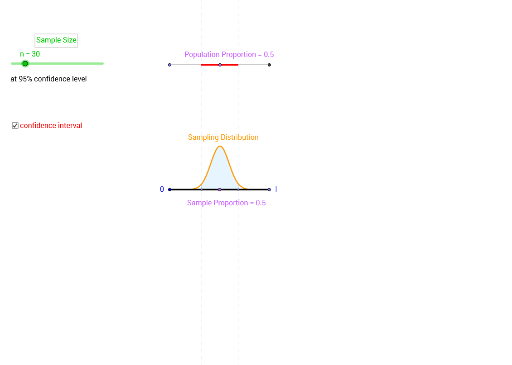
This example demonstrates how to calculate the confidence interval for proportions using sample data. It covers key concepts in probability and statistics, such as sample proportion, confidence level, and confidence interval. Using GeoGebra commands like OrthogonalLine, Point, Line, Intersect, etc., the construction process of confidence intervals is visually illustrated. Suitable for high school students and statistics enthusiasts.
GeoGebra Commands & Parameters
OrthogonalLine(C, xAxis) → bPoint(yAxis) → ALine(A, xAxis) → aIntersect(a, b) → ESegment(A, E) → cPoint(c) → FSegment(D, C) → dPoint(d) → BIntegral(h, m - (2 * s), m + (2 * s)) → iSegment(I, J) → jPoint(d, m - (2 * s)) → KPoint(d, m + (2 * s)) → LOrthogonalLine(K, d) → lOrthogonalLine(L, d) → p
AI Drawing Prompt Reference
Draw a graph demonstrating confidence intervals for proportions, including x and y axes, a point on the y-axis, a line through this point and the x-axis, and another line through the intersection of this line and a perpendicular line to the x-axis. Connect these points with line segments and perpendiculars, then plot an integral curve between the perpendiculars to visualize the confidence interval.
The prompt above was compiled from the original drawing commands and is for reference only.