
Confidence Interval for House Paint
Loading the math board and drawing, please wait…
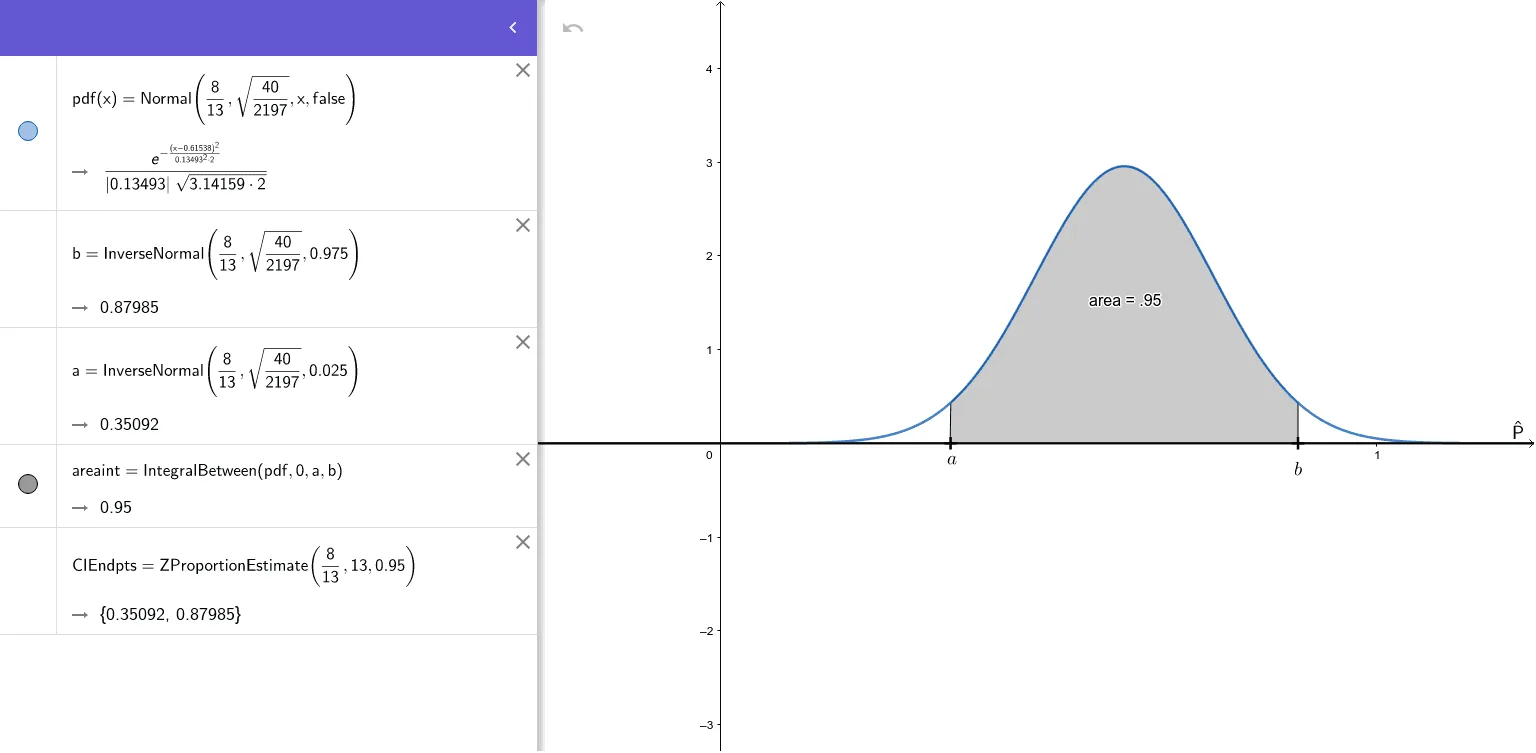
This example demonstrates the concept of confidence intervals through a simulation of house paint. Using commands such as Normal, InverseNormal, and IntegralBetween, users can visually understand the calculation of confidence intervals. Suitable for high school statistics courses, this example helps students grasp the calculation and application of confidence intervals.
GeoGebra Commands & Parameters
Normal(8 / 13, sqrt(40 / 2197), x, false) → pdfInverseNormal(8 / 13, sqrt(40 / 2197), 0.975) → bInverseNormal(8 / 13, sqrt(40 / 2197), 0.025) → aIntegralBetween(pdf, 0, a, b) → areaintZProportionEstimate(8 / 13, 13, 0.95) → CIEndpts
AI Drawing Prompt Reference
Draw a normal distribution curve representing the confidence interval for paint samples. First, plot a normal distribution with mean 8/13 and standard deviation sqrt(40/2197). Then, mark the upper and lower limits for a 95% confidence level, and calculate and label the area of the confidence interval.
The prompt above was compiled from the original drawing commands and is for reference only.