
Confidence Interval and Geometric Construction in GeoGebra
Loading the math board and drawing, please wait…
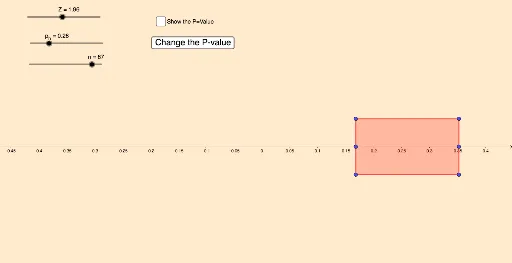
This example demonstrates the construction of confidence intervals using GeoGebra, integrating probability statistics with geometric drawing techniques. Key mathematical concepts include confidence intervals, geometric constructions of triangles and polygons, and matrix operations for data processing. The construction involves commands like Random, Polygon, and Segment to generate visual representations. Suitable for high school students learning probability and geometry, or for educational demonstrations in mathematics.
GeoGebra Commands & Parameters
Random((r * 100) - 1.4 / Z, (s * 100) + 1.4 / Z) → mPolygon(E, G, H, F) → q1, e, g, h, fSegment(C, I) → i
AI Drawing Prompt Reference
Draw a geometric figure consisting of a triangle and a square. The triangle and square should be connected by line segments to form a closed shape. The figure should show the relationship between the triangle and the square, such as the triangle placed inside the square. The construction order should start with drawing the triangle, then adding the square, and finally connecting them to form the overall structure.
The prompt above was compiled from the original drawing commands and is for reference only.