
Cone and Trigonometric Functions Exercise
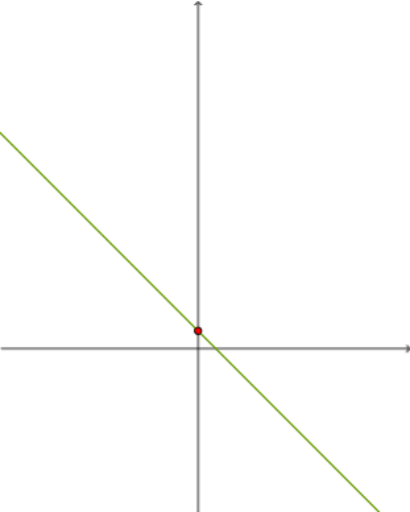
Loading the math board and drawing, please wait…
In collections
LINEAR FUNCTIONS
This example demonstrates the relationship between a cone and trigonometric functions. Key mathematical concepts include the geometric properties of a cone and the periodicity of trigonometric functions. Using GeoGebra commands such as Random, RandomElement, and Textfield, the example dynamically shows the cross-section of a cone and the changes in the trigonometric function graph. Suitable for high school mathematics education and learning.
GeoGebra Commands & Parameters
Random(-10, 10) → d_1Random(-10, 10) → b_1Random(-10, 10) → bRandomElement({-5, -4, -3, -2, -1, 1, 2, 3, 4, 5}) → c_1Random(-10, 10) → aRandomElement({-5, -4, -3, -2, -1, 1, 2, 3, 4, 5}) → a_1RandomElement({-5, -4, -3, -2, -1, 1, 2, 3, 4, 5}) → cTextfield(h) → InputBox1Textfield(m) → InputBox2Textfield(f) → InputBox4Random(-10, 10) → d_2Intersect(g, yAxis) → CTableText({{A1_1, B_1, C_1, D_1}, {-3, g(-3), h(-3), f(-3)}, {-2, g(-2), h(-2), f(-2)}, {-1, g(-1), h(-1), f(-1)}, {0, g(0), h(0), f(0)}, {1, g(1), h(1), f(1)}, {2, g(2), h(2), f(2)}, {3, g(3), h(3), f(3)}, {1, e, l, k}}, "|_r") → text3_1
AI Drawing Prompt Reference
Draw a cone and plot the sine and cosine functions on its side to demonstrate their periodicity. Use random numbers to generate the base radius and height of the cone, as well as the parameters for the functions. First, draw the side of the cone, then plot the sine and cosine functions on it, showing their periodic nature. Ensure that the sine and cosine function plots dynamically change on the cone's side projection.
The prompt above was compiled from the original drawing commands and is for reference only.