
Compounding Interest in GeoGebra: Exponential Growth and Yield Curves
Loading the math board and drawing, please wait…
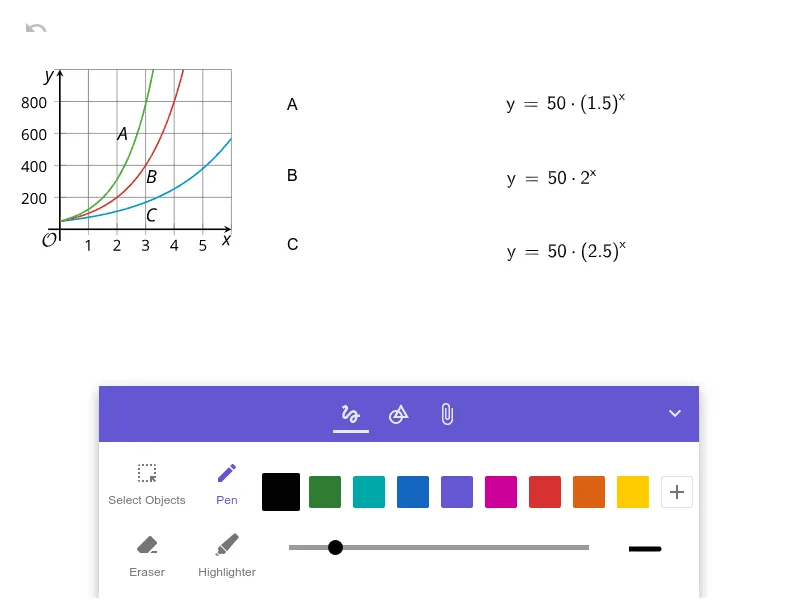
This example demonstrates how compounding interest grows over time: a principal accumulates by repeatedly adding interest at a fixed rate, producing an exponential-style growth pattern. The key concepts include the discrete compounding model, the relationship to exponential/power expressions, how time steps and the interest-rate parameter affect growth speed, and interpreting the results via graphing. For construction in GeoGebra, the typical workflow is to define a compounding-interest formula as a function object, introduce parameters (initial principal, rate, number of periods), and visualize the result using a function graph and/or plotted points across periods. Even though no GeoGebra command list is provided, the essential objects are usually function/graphing elements and (optionally) slider controls for interactive parameter changes. Suitable for late middle school through early university, especially for math modeling, quantitative reasoning, and finance-math visualization practice.
AI Drawing Prompt Reference
Draw a graph showing compound interest growth. Define parameters for initial principal, fixed rate, and number of periods. Calculate the principal value after each compounding period to form an exponential growth curve. Mark the initial and final principal values on the graph and add a horizontal line representing the fixed rate. Ensure the graph is clear to show the effect of compounding over time.
The prompt above was compiled from the original drawing commands and is for reference only.