
Comparison of Riemann's Sums
Loading the math board and drawing, please wait…
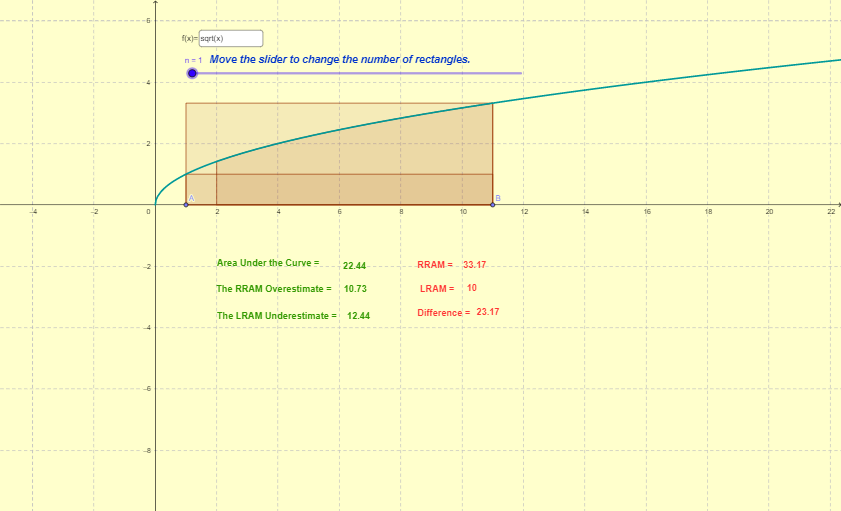
This example demonstrates the comparison between left-hand and right-hand Riemann sum approximations. It involves core mathematical concepts such as definite integrals, Riemann sums, and function approximation. The construction utilizes GeoGebra commands like UpperSum, LowerSum, Integral, and Textfield to plot functions, calculate approximations, and display results. Suitable for high school and above students learning calculus to visually understand the concept of definite integrals and the approximation process of Riemann sums.
GeoGebra Commands & Parameters
UpperSum(f, x(A), x(B), n) → uppersumLowerSum(f, x(A), x(B), n) → lowersumIntegral(f, 2, 11) → aTextfield(f) → InputBox1
AI Drawing Prompt Reference
Draw a function graph and display its left and right Riemann sum approximations, while labeling the exact integral value and showing the function expression beside it to compare the relationships between different approximation methods and the exact value. Start by plotting the function curve, then calculate and draw the left and right Riemann sums, and finally label the integral result and function expression.
The prompt above was compiled from the original drawing commands and is for reference only.