
Comparing Fractions by matte Lena
Loading the math board and drawing, please wait…
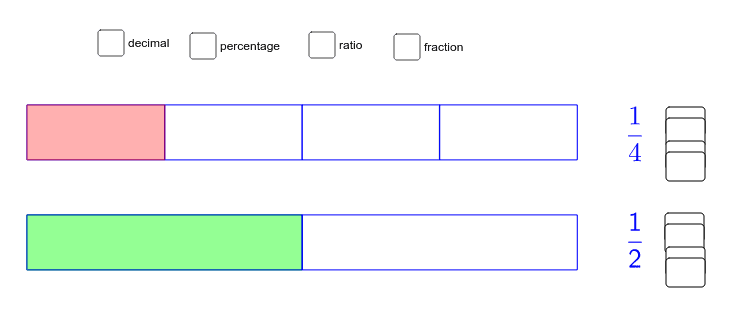
This example visually demonstrates the comparison of fractions. It involves core mathematical concepts such as fractions, geometric representations, and comparison methods. Construction highlights the use of GeoGebra commands and objects like Point, Segment, OrthogonalLine, Circle, Intersect, Polygon, FractionText, and Sequence. Suitable for middle school mathematics education to help students intuitively understand fraction comparison concepts.
GeoGebra Commands & Parameters
Point(yAxis) → APoint(Circle[A, 10]) → BSegment(A, B) → aOrthogonalLine(A, a) → bOrthogonalLine(B, a) → cCircle(A, 1) → dCircle(B, 1) → eIntersect(d, b, 2) → CIntersect(e, c, 2) → DPolygon(A, B, D, C) → poly1, a_2, b_1, d_1, c_1FractionText(n / i) → text1Sequence(Polygon[(r, 0), (r + a / i, 0), (r + a / i, 1), (r, 1)], r, 0, (n * a / i) - a / i, a / i) → list2Sequence(Polygon[(p, 0), (p + a / i, 0), (p + a / i, 1), (p, 1)], p, 0, a - a / i, a / i) → list1Sequence(Polygon[(q, 2), (q + a / j, 2), (q + a / j, 3), (q, 3)], q, 0, a - a / j, a / j) → list3Sequence(Polygon[(r, 2), (r + a / j, 2), (r + a / j, 3), (r, 3)], r, 0, (k * a / j) - a / j, a / j) → list4FractionText(k / j) → text6
AI Drawing Prompt Reference
Draw a coordinate system with point A on the y-axis and point B on a circle centered at A with radius 10. Connect A and B, and draw perpendicular lines from A and B to the line AB, intersecting circles centered at A and B with radius 1 to get points C and D. Use points A, B, D, and C to draw a quadrilateral. Draw two line segments of lengths n/i and k/j on the x-axis, and draw two rectangles above them with height 1 to represent fractions n/i and k/j. Draw two rectangles above the x-axis to represent fractions i and j.
The prompt above was compiled from the original drawing commands and is for reference only.