
Compare Three Line Graphs
Loading the math board and drawing, please wait…
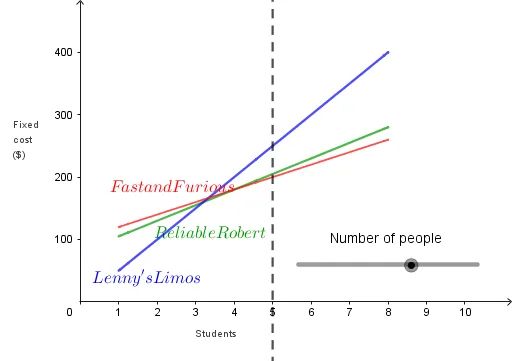
This example demonstrates how to compare three line graphs. It involves key mathematical concepts such as function graphs, ratios, and symmetry. Using GeoGebra commands like F_1, L, R_1, text3, text4, n, text5, f, text7, R, Lenny's, F, it visually illustrates the relationships between different functions. Suitable for high school mathematics education and learning.
GeoGebra Commands & Parameters
F_1(x) = (20 * x) + 100L(x) = (50 * x)R_1(x) = (25 * x) + 80Numeric n(5.0)x = nR(x) = If[1 ≤ x ≤ 8, R_1]Lenny's(x) = If[1 ≤ x ≤ 8, L]F(x) = If[1 ≤ x ≤ 8, F_1]
AI Drawing Prompt Reference
Draw a coordinate plane with three line segments restricted to the x-interval from 1 to 8. The first line starts near (1,120) with slope 20 and intercept 100; the second line starts near the origin with slope 50; the third line starts near (1,105) with slope 25 and intercept 80. Add a vertical dashed line at x=5 to compare the three lines' values at that point. Use distinct colors or line styles for each line, and label them with their equations or names to clearly show differences in steepness and starting points.
The prompt above was compiled from the original drawing commands and is for reference only.