
Color Mixtures & Drink Mix Lesson
Loading the math board and drawing, please wait…
In collections
Unit 2 Classwork: Intro to Ratios
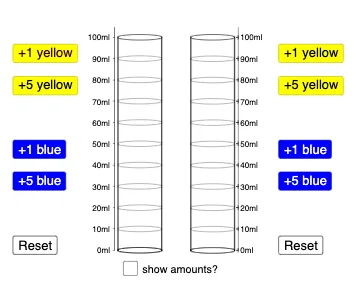
This example demonstrates understanding ratios and statistical characteristics through color mixtures and drink mixtures. It involves core math concepts like ratios, statistical characteristics, terms, LCM and GCD, real numbers, and 2D vectors. GeoGebra commands used include Ellipse, Point, If, Segment, Vector, Translate, Polygon, Sequence, Ray, with objects like top, yellow, e, F, blue, ratio2, ratio, a, A1-A21, B2-B11. Suitable for middle school and above for learning proportions, statistics, and geometric constructions.
GeoGebra Commands & Parameters
Ellipse((1, 0), (2.5, 0), 1.5) → ePoint(e) → FIf(yellow + blue ≟ 0, 1, If[ratio ≤ 1, 0, (0.79 * ratio2^(2)) - (1.72 * ratio2) + 0.99]) → aIf(yellow + blue ≟ 0, 1, If[ratio ≥ 1, 1, (-0.85 * ratio^(2)) + (1.78 * ratio)]) → bIf(yellow + blue ≟ 0, 1, If[ratio ≥ 1, 0, (0.79 * ratio^(2)) - (1.72 * ratio) + 0.99]) → cPoint(e) → ESegment(F, (x(F), ht)) → fVector(F, G) → uTranslate(e, u) → e'Polygon(G, F, E, H) → poly2, g, f_1, e_1, hSegment(I, F) → iSegment(E, J) → jVector(F, I) → vEllipse((1, ht), (2.5, ht), 1.5) → pEllipse((1, 0), (2.5, 0), 1.5) → qSegment(H, E) → lEllipse((1, top), (2.5, top), 1.5) → kSegment(C, A) → mSegment(B, D) → nVector(A, C) → wVector(A, K) → rTranslate(B, r) → B'Polygon(K, A, B, B') → poly1, k_1, a_1, b_1, b'If(yellow2 + blue2 ≟ 0, 1, If[ratiox ≤ 1, 0, (0.79 * (1 / ratiox)^(2)) - (1.72 * 1 / ratiox) + 0.99]) → a2If(yellow2 + blue2 ≟ 0, 1, If[ratiox ≥ 1, 1, (-0.85 * ratiox^(2)) + (1.78 * ratiox)]) → b2If(yellow2 + blue2 ≟ 0, 1, If[ratiox ≥ 1, 0, (0.79 * ratiox^(2)) - (1.72 * ratiox) + 0.99]) → c2Vector(F, A) → dTranslate(q, d) → q'Translate(q, d) → q'_1Translate(q'_1, r) → sTranslate(q'_1, r) → tSegment(B', B) → g_1Segment(K, A) → h_1Sequence(Ellipse[(1, k), (2.5, k), 1.5], k, 10, 90, 10) → list1Translate(list1, d) → list1'Ray((8.5, 0), (8.5, 1)) → i_1Sequence((8.5, n), n, 0, 100, 10) → list2Point(i_1) → LSequence(Text[m + "ml", (8.65, m - 1.5)], m, 0, 100, 10) → list3Polygon(M, N, O, P) → poly3, m_1, n_1, o, p_1
AI Drawing Prompt Reference
The figure consists of multiple ellipses, points, line segments, vectors, and triangles. Ellipses represent color mixing areas, points mark key positions, line segments connect these points, vectors indicate directions, and triangles are formed by combining points and vectors. The construction order is: first draw ellipses, then determine points, then connect points, define vectors, and finally combine points and vectors to form triangles. The overall figure has a geometric construction feel, with elements connected by line segments and vectors to create a coherent visual structure.
The prompt above was compiled from the original drawing commands and is for reference only.