
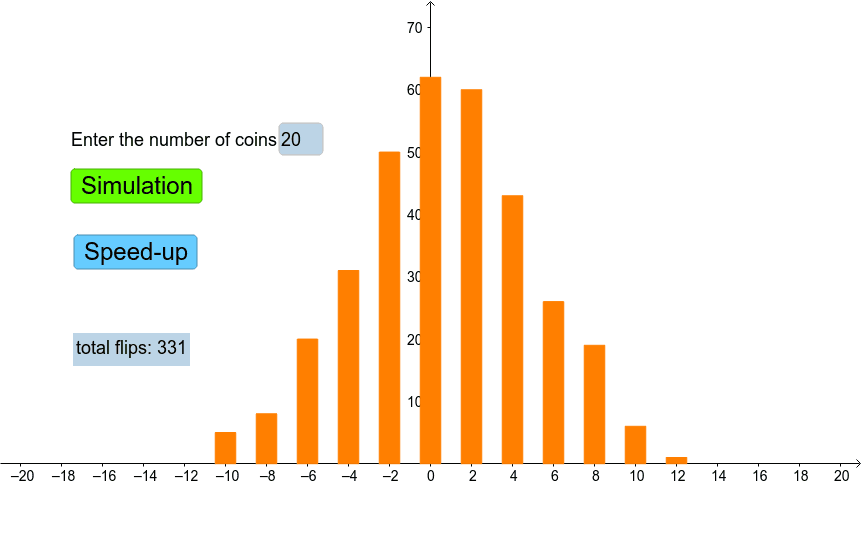
Coin flipping 2n times
Loading the math board and drawing, please wait…
This example demonstrates the distribution pattern and median value of heads and tails after flipping a coin 2n times, involving core math concepts like Binomial Distribution, Correlation, and Geometric Transformations. It constructs frequency bar charts and dynamic text using GeoGebra commands like Frequency, Sequence, Element, Max, BarChart, and Textfield, suitable for high school students learning probability statistics and data analysis or for classroom demonstrations.
GeoGebra Commands & Parameters
Frequency(diflist) → list1Sequence(Random[0, 1], i, 1, n) → flipsFrequency(flips) → ffElement(ff, 1) → headMax(list1) → ymaxBarChart(diflist, 1) → aTextfield(n) → inputBox1
AI Drawing Prompt Reference
Illustrate the distribution pattern and median value of heads and tails after flipping a coin 2n times, showing core math concepts like Binomial Distribution, Correlation, and Geometric Transformations through dynamic frequency bar charts and text, suitable for high school probability statistics and data analysis learning. Start by generating a random sequence for coin flips, then calculate frequencies and draw bar charts, finally labeling the number of flips and maximum frequency value.
The prompt above was compiled from the original drawing commands and is for reference only.