
Classifying Critical Points of Surfaces
Loading the math board and drawing, please wait…
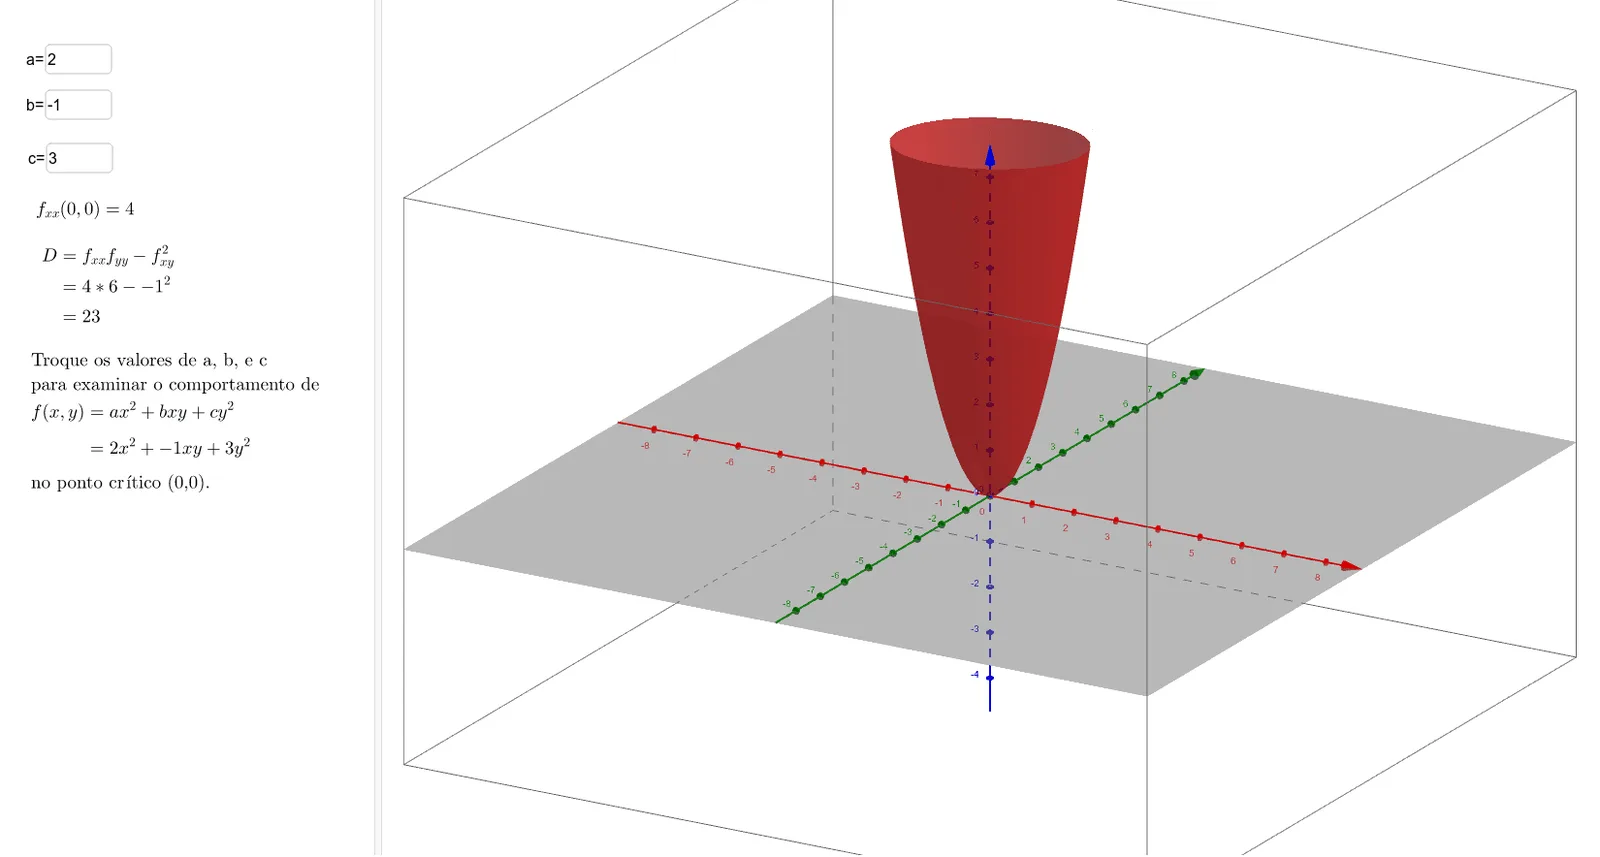
This example demonstrates how to classify critical points on surfaces using GeoGebra. It involves core mathematical concepts such as critical points, second partial derivatives, discriminant, and function characteristics. Construction highlights include using Textfield to display variables a, b, c, f, fxxText, DiscriminantText; InputBox3 for input; and aInput, bInput, InputBox3 for text construction. Suitable for high school and above mathematics learners to visualize and understand the classification of extrema on multivariable functions.
GeoGebra Commands & Parameters
Textfield(a) → aInputTextfield(b) → bInputTextfield(c) → InputBox3
AI Drawing Prompt Reference
Create a 3D surface plot with adjustable parameters a, b, c. Show critical points on the surface, calculate second partial derivatives and discriminant, and classify extrema (maxima, minima, saddle points) with different colors. Display variable values and discriminant results in text fields.
The prompt above was compiled from the original drawing commands and is for reference only.