
Circular Fractions Visualization: Geometry Demo
Loading the math board and drawing, please wait…
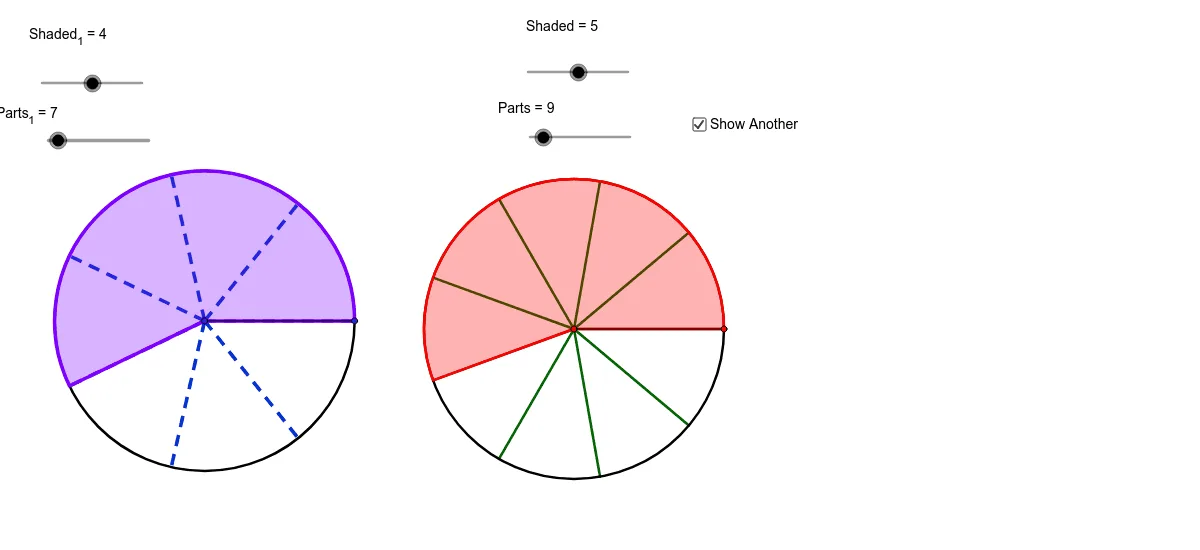
This GeoGebra example demonstrates the geometric visualization of circular fractions. It explores core concepts including circle properties, sector areas, and isosceles triangles. The construction utilizes commands like Circle, CircleSector, Point, Segment, and Zip to create dynamic interactive elements. Suitable for middle to high school students to understand the relationship between fractions and geometry through interactive manipulation.
GeoGebra Commands & Parameters
Circle(A, Size) → cPoint(c) → BSegment(A, B) → aAppend(Sequence[Rotate[B, i, A], i, (360 / Parts_1)°, 359.9°, (360 / Parts_1)°], Rotate[B, 359.99°, A]) → ListPCircleSector(A, B, Element[ListP, Shaded_1]) → ShadeCircle(C, Size) → dPoint(d) → DAppend(Sequence[Rotate[D, s, C], s, (360 / Parts)°, 359.9°, (360 / Parts)°], Rotate[D, 359.99°, C]) → ListP2CircleSector(C, D, Element[ListP2, Shaded]) → Shade2Segment(C, D) → bZip(Segment[C, W], W, ListP2) → ListS2Zip(Segment[A, Z], Z, ListP) → ListS
AI Drawing Prompt Reference
Draw a circle and place multiple points evenly on its circumference, then connect the center to these points to form sectors. Next, draw another circle and place multiple points evenly on its circumference, connecting the center to these points to form sectors as well. Finally, connect the corresponding points on each circle to form a series of chords.
The prompt above was compiled from the original drawing commands and is for reference only.