
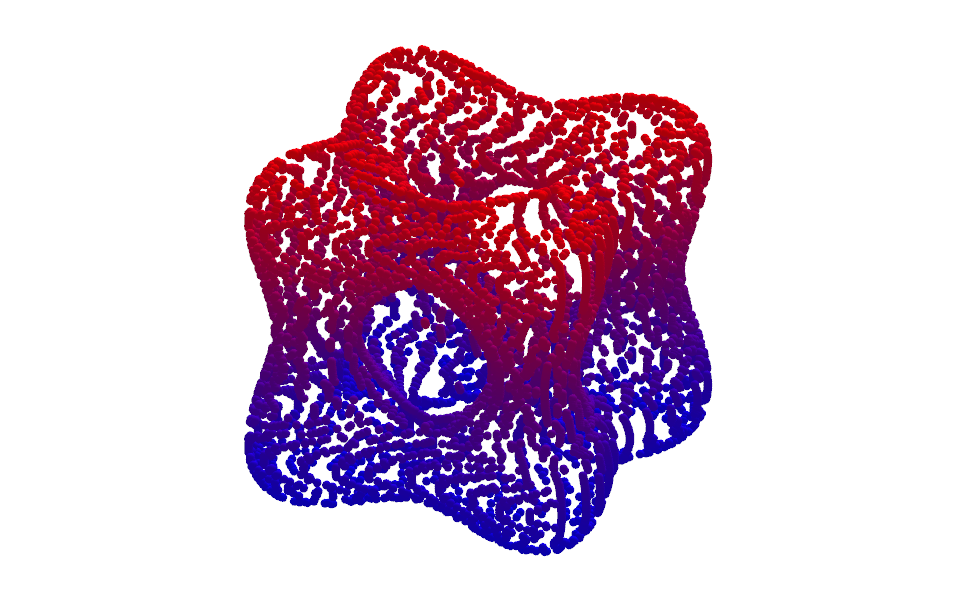
Chmutov Curve
Loading the math board and drawing, please wait…
This example demonstrates the drawing of an implicit curve, defined by an equation rather than parametric or explicit forms. The Sequence command is used to generate a series of points, which are then used to draw the curve. Suitable for high school mathematics education, particularly in coordinate geometry and function graphing.
GeoGebra Commands & Parameters
Sequence(Point[ci, i], i, 0, 1, 1 / n) → liste1Sequence((x(Element[liste1, i]), y(Element[liste1, i]), zz), i, 1, n) → liste2
AI Drawing Prompt Reference
Draw an implicit curve by generating a series of points using a sequence and connecting them to form the curve, suitable for high school mathematics education, demonstrating coordinate geometry and function graphing.
The prompt above was compiled from the original drawing commands and is for reference only.