
Change in Slope/Y-Intercept Constant
Loading the math board and drawing, please wait…
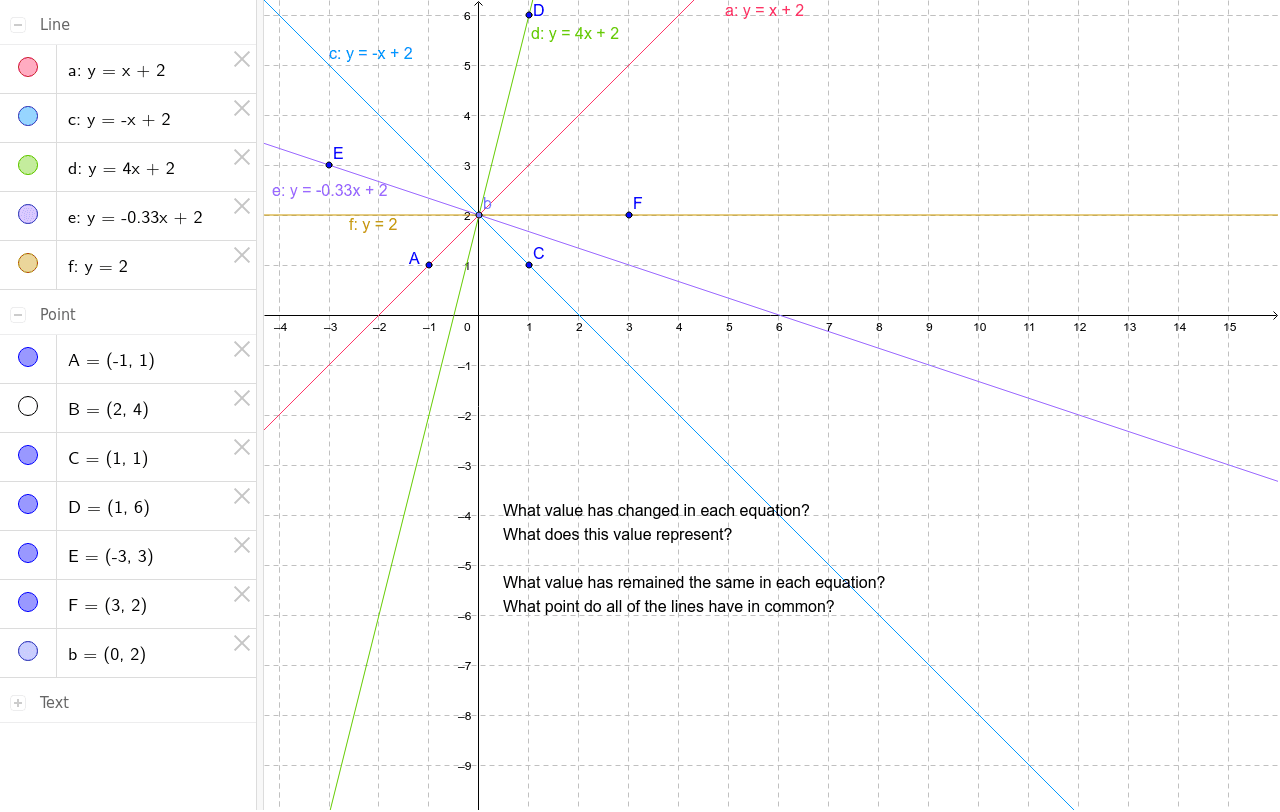
This example demonstrates the effect on the graph of a linear function when the slope changes while the y-intercept remains constant. Key math concepts include linear functions, slope, y-intercept, and the slope-intercept form of a line equation. Construction involves using commands like Point and Line, with objects such as b, A, B, a, C, c, D, d, E, e, text1, F, f. Suitable for middle school and above students to explore function graph transformations or for educational purposes.
GeoGebra Commands & Parameters
Point(yAxis) → bLine(A, B) → aLine(b, C) → cLine(b, D) → dLine(b, E) → eLine(b, F) → f
AI Drawing Prompt Reference
Draw a straight line and keep a point on the y-axis fixed, then draw multiple lines from this point with different slopes to show the effect of slope changes on the lines, while keeping the y-intercept constant to observe the transformation of function graphs.
The prompt above was compiled from the original drawing commands and is for reference only.