
Calculating Measures of Center and Variability
Loading the math board and drawing, please wait…
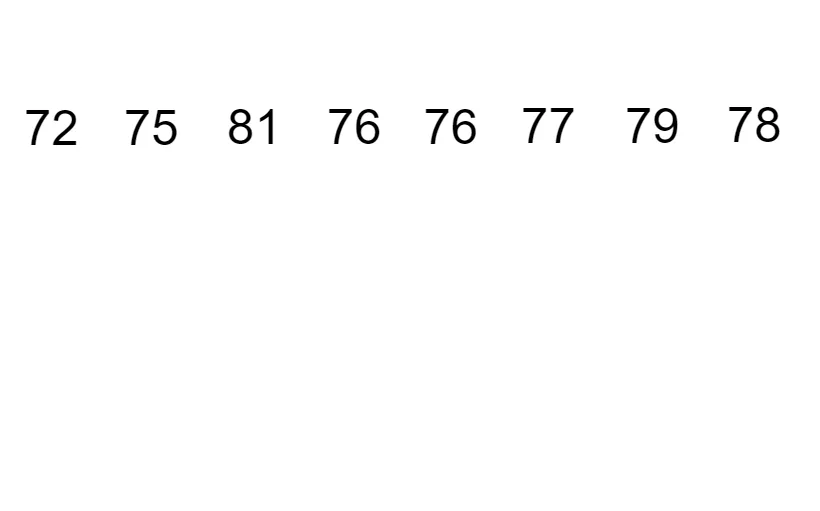
This example demonstrates how to use GeoGebra to calculate measures of center (mean, median) and variability (variance, standard deviation) for a set of data. Core math concepts include data statistics, descriptive statistics, mean, median, variance, and standard deviation. Construction highlights: GeoGebra commands/objects used include objects: a, b, c, d, e, f, g, h. Suitable for middle school and above students to learn basic data statistics methods, or for teaching demonstrations.
GeoGebra Commands & Parameters
Inlinetext aInlinetext bInlinetext cInlinetext dInlinetext eInlinetext fInlinetext gInlinetext h
AI Drawing Prompt Reference
Create an educational diagram illustrating measures of center and variability for a dataset. The image should include eight text labels displaying values for mean, median, variance, and standard deviation. Arrange these labels neatly around a simple data plot or frequency chart to visually compare central tendency and spread. The overall design should be clear and suitable for middle school math instruction, emphasizing key statistical concepts without extra decorations.
The prompt above was compiled from the original drawing commands and is for reference only.