
Boxplots: Interactive Demonstration with GeoGebra
Loading the math board and drawing, please wait…
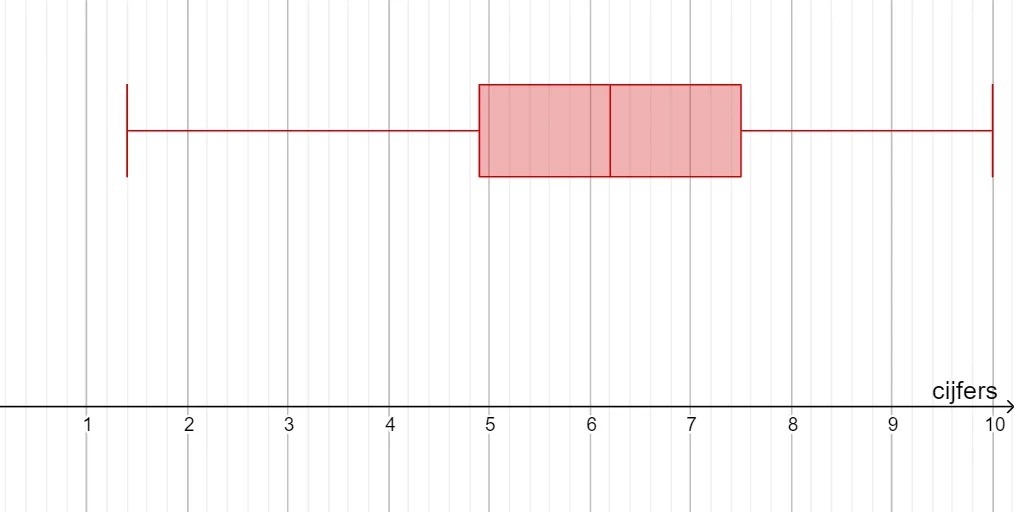
① This GeoGebra example demonstrates how to construct and interpret boxplots, visualizing the five-number summary (minimum, lower quartile, median, upper quartile, maximum) of a dataset. ② Core mathematical concepts include descriptive statistics, quartiles, data distribution, and outlier detection on the real number line. ③ Construction details: The BoxPlot command is used to generate the boxplot, while the Text command adds labels; objects include 25 data points (A1 to A25) and variables b and B_1, possibly for controlling data or auxiliary constructions; the original tags also mention rectangles and isosceles triangles, suggesting geometric aids for understanding boxplot construction. ④ Suitable for middle school statistics lessons, high school math, and introductory college statistics courses, helping learners grasp data spread and identify outliers.
GeoGebra Commands & Parameters
BoxPlot(2, 0.3333333333333333, {A2, A3, A4, A5, A6, A7, A8, A9, A10, A11, A12, A13, A14, A15, A16, A17, A18, A19, A20, A21, A22, A23, A24, A25}, false) → bText(" B2:B25 ", (0, 1)) → B_1
AI Drawing Prompt Reference
Create a boxplot with 25 data points from A2 to A25. First, generate the boxplot using these data points to show the minimum, lower quartile, median, upper quartile, and maximum. Then, add the label 'B2:B25' above the axis to help understand the boxplot construction.
The prompt above was compiled from the original drawing commands and is for reference only.