
Boxplots and Statistical Measures Interactive Demo
Loading the math board and drawing, please wait…
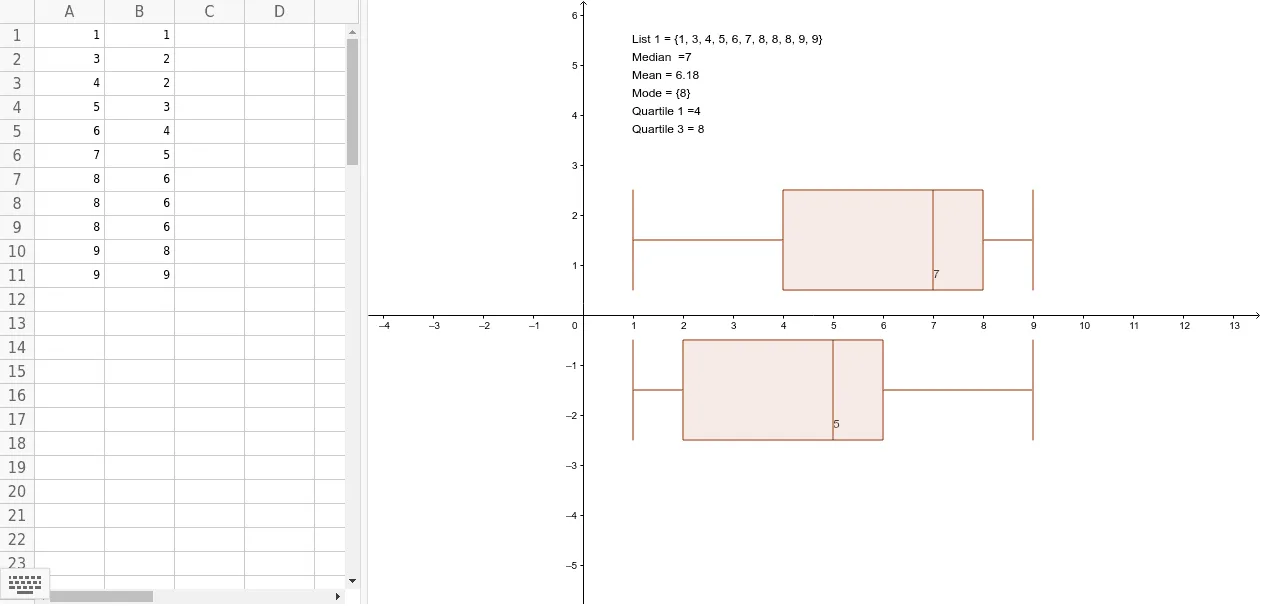
This GeoGebra example demonstrates the construction of boxplots alongside key descriptive statistics such as mean, median, mode, and quartiles. It visualizes data distribution through the five-number summary (minimum, Q1, median, Q3, maximum) and highlights the concept of spread and central tendency. The construction uses the BoxPlot command to generate the box-and-whisker plot, and Mean, Median, Mode, Q1, Q3 commands to compute statistical values. Multiple point objects (A1-A11, B1-B11) and lists L1, L2 are defined, with text1 displaying results. Suitable for middle school or high school statistics lessons, as well as introductory college statistics courses, this interactive tool helps learners grasp how boxplots summarize data and how outliers affect the display.
GeoGebra Commands & Parameters
BoxPlot(1.5, 1, L1) → aBoxPlot(-1.5, 1, L2) → bMean(L1) → Mean1Median(L1) → Median1Mode(L1) → Mode1Q1(L1) → Quartile1Q3(L1) → Quartile3
AI Drawing Prompt Reference
Create an interactive statistical teaching diagram showing two boxplots placed horizontally above and below a central axis. Each boxplot should display the five-number summary: minimum, first quartile, median, third quartile, and maximum, with boxes and whiskers indicating spread. Next to each plot, label the mean, median, mode, first quartile, and third quartile values. Use distinct colors for the two datasets, and optionally show individual data points below each boxplot to illustrate how outliers affect the display. The layout should be clean and suitable for classroom demonstration.
The prompt above was compiled from the original drawing commands and is for reference only.